
Overview
Objective
Strategy behind the fund
Global AlphaShare price and charges
Series
FNAV
16.54% change
-1.31%Management fee
0.57%Operating expenses
0.02%Gross expense ratio
0.59%Net expense ratio
0.59%Fund facts
Fund launch date
July 15, 2009
Fund size
$1,757.6m
Benchmark
MSCI ACWI Index
Current number of holdings
93
Active share
79%**
Annual turnover
39%
Style
Long-term, bottom-up growth
Guideline number of holdings
70-120
** Relative to MSCI ACWI Index.
Source: Baillie Gifford & Co and relevant underlying index provider(s).
Portfolio characteristics
The fund's characteristics compared to the index.
As at 30 June 2026
| Fund | MSCI ACWI Index | |
|---|---|---|
| Market cap (weighted average) | $1176.66bn | $1381.10bn |
| Price / Book | 5.38 | 4.05 |
| Price / Earnings (12 months forward) | 18.07 | 17.31 |
| Earnings growth (5 year historic) | 15.91% | 12.55% |
| Return on equity (12 months forward) | 29.41% | 23.26% |
| Standard deviation (trailing 3 years) | 14.25% | 10.47% |
| Beta | 1.07 | N/A |
Source: Revolution, MSCI. Canadian dollars.
Index disclaimer
Source: MSCI. The MSCI information may only be used for your internal use, may not be reproduced or redisseminated in any form and may not be used as a basis for or a component of any financial instruments or products or indices. None of the MSCI information is intended to constitute investment advice or a recommendation to make (or refrain from making) any kind of investment decision and may not be relied on as such. Historical data and analysis should not be taken as an indication or guarantee of any future performance analysis, forecast or prediction. The MSCI information is provided on an ‘as is’ basis and the user of this information assumes the entire risk of any use made of this information. MSCI, each of its affiliates and each other person involved in or related to compiling, computing or creating any MSCI information (collectively, the ‘MSCI Parties’) expressly disclaims all warranties (including, without limitation, any warranties or originality, accuracy, completeness, timeliness, non-infringement, merchantability and fitness for a particular purpose) with respect to this information. Without limiting any of the foregoing, in no event shall any MSCI Party have any liability for any direct, indirect, special, incidental, punitive, consequential (including, without limitation, lost profits) or any other damages (www.msci.com).
Important information
The information provided does not constitute an offer of or solicitation for purchase or sale of securities or provision of any investment services. Baillie Gifford does not currently have any funds that offer securities under a simplified prospectus for general offer or sale within Canada. No securities regulatory authority in Canada has reviewed or in any way passed upon this website or the merits of any investment available, and any representation to the contrary is an offence.
Persons resident or domiciled in Canada should consult with their professional advisers as to whether they require any governmental or other consents in order to enable them to trade.
You can read details of our Legal and Important Information here.
Trade Matching Statement
This Trade-Matching Statement is being provided in accordance with National Instrument 24-101 -"Institutional Trade Matching and Settlement" and Companion Policy 24-101 CP (the "National
Instrument"). It applies to all trades that are subject to the National Instrument. View the whole statement.
Fund performance
Stock level attribution
Top and bottom 5 relative contributors
One month to: 30 June 2026
| Holding | Contribution |
|---|---|
| Space Exploration Technologies Corp | 0.46% |
| Broadcom Inc | 0.29% |
| Kokusai Electric | 0.24% |
| Apple | 0.23% |
| Doordash Inc | 0.20% |
| On Semiconductor Corp | -0.26% |
| AppLovin | -0.23% |
| Applied Materials | -0.22% |
| Micron Technology | -0.21% |
| Petrobras | -0.15% |
Fund portfolio holdings
The list of top 10 holdings that this fund invests in.
As at: 30 June 2026
| # | Holding | % of total assets |
|---|---|---|
| 1 | TSMC | 5.54 |
| 2 | NVIDIA | 5.07 |
| 3 | Alphabet | 3.72 |
| 4 | Amazon.com | 3.20 |
| 5 | Samsung Electronics | 2.27 |
| 6 | Tencent | 2.03 |
| 7 | Martin Marietta Materials | 1.91 |
| 8 | Mastercard | 1.87 |
| 9 | Microsoft | 1.83 |
| 10 | Meta Platforms | 1.66 |
Sector
As at: 30 June 2026
# | Sector | Fund % | Benchmark %* | Difference % |
|---|---|---|---|---|
| 1 | Information Technology | 29.10 | 32.09 | -2.99 |
| 2 | Financials | 13.22 | 16.18 | -2.97 |
| 3 | Consumer Discretionary | 12.80 | 8.70 | 4.10 |
| 4 | Industrials | 11.75 | 11.04 | 0.71 |
| 5 | Communication Services | 10.43 | 7.82 | 2.61 |
| 6 | Health Care | 8.63 | 8.27 | 0.36 |
| 7 | Materials | 5.23 | 3.56 | 1.67 |
| 8 | Energy | 3.54 | 3.53 | 0.02 |
| 9 | Consumer Staples | 3.16 | 4.72 | -1.56 |
| 10 | Real Estate | 1.33 | 1.59 | -0.25 |
| 11 | Cash | 0.81 | 0.00 | 0.81 |
Total | 100.00 | 97.49 |
Top 10 geographical locations
As at: 30 June 2026
# | Top 10 locations | Fund % | Benchmark %* | Difference % |
|---|---|---|---|---|
| 1 | United States | 58.26 | 63.63 | -5.37 |
| 2 | Taiwan | 6.41 | 3.33 | 3.08 |
| 3 | Japan | 5.29 | 5.00 | 0.29 |
| 4 | China | 4.30 | 2.32 | 1.98 |
| 5 | Brazil | 3.68 | 0.46 | 3.22 |
| 6 | Ireland | 3.29 | 0.08 | 3.21 |
| 7 | South Korea | 3.13 | 2.89 | 0.24 |
| 8 | Canada | 2.28 | 2.93 | -0.65 |
| 9 | Sweden | 1.93 | 0.73 | 1.20 |
| 10 | UK | 1.69 | 3.03 | -1.34 |
Total | 90.26 | 84.40 |
Region
As at: 30 June 2026
# | Region | Fund % | Benchmark %* | Difference % |
|---|---|---|---|---|
| 1 | North America | 60.54 | 66.56 | -6.02 |
| 2 | Emerging Markets | 19.59 | 12.12 | 7.48 |
| 3 | Europe (ex UK) | 11.20 | 11.15 | 0.05 |
| 4 | Developed Asia Pacific | 6.16 | 7.15 | -0.98 |
| 5 | UK | 1.69 | 3.03 | -1.34 |
| 6 | Cash | 0.81 | 0.00 | 0.81 |
Total | 100.00 | 100.00 |
Quarterly transactions
Transactions for the three-month period ending 30 June 2026
New purchases
- Apple
- Axon Enterprise Inc
- BESI
- Cullen/Frost Bankers
- Lasertec Corp.
- LINDE PLC
- Mediatek
- RBC Bearings Inc
- SK Hynix Inc
- Space Exploration Technologies Corp
- TIDEWATER INC NEW
- WARTSILA
Complete sales
- Edenred
- Enphase Energy Inc
- Kweichow Moutai 'A'
- Nippon Paint
Additions
- Amazon.com
- AutoZone
- Philip Morris
Reductions
- Disco
- Meta Platforms Inc
- Microsoft
- On Semiconductor Corp
- Royalty Pharma
- Ryanair ADR
- Samsung Electronics
- Service Corp.Intl.
- Space Exploration Technologies Corp
- Texas Instruments
Insights
Key articles, videos and podcasts relating to the fund:
Filters
Insights

Global Alpha Q2 investor letter
The Global Alpha Team reflects on recent performance, portfolio changes and market developments.
Medpace: easing the bottleneck in drug development
Why Global Alpha sees Medpace as part of drug development’s essential infrastructure.Global Alpha Q2 update
Investment specialist Ben Drury reflects on recent performance, portfolio changes and market developments.
Global Alpha Forum: the changing growth opportunity set
How Global Alpha is seeking growth across companies, regions and real-world constraints.
Stock story: Sea Limited
Amy Leishman examines Sea’s role in Southeast Asia’s changing digital economy.
Stock markets: ecology and evolution
Why capital flows and market narratives are changing how global markets behave.
The big squeeze: bottlenecks as advantage
When demand outstrips supply, companies that sit astride the pinch point can gain an enduring edge.
AI: valuing scarcity
AI is creating new abundance and shifting bottlenecks. We explore which businesses can win in the long term.
Global Alpha Q1 investor letter
The Global Alpha Team reflects on recent performance, portfolio changes and market developments.Global Alpha Q1 update
Investment manager Malcolm MacColl reflects on recent performance, portfolio changes and market developments.
AI is coming for your mind
AI is reshaping human cognition. What does that mean for workers, companies and society?
Global Alpha insights: agentic commerce
As AI simplifies shopping, where does durable ecommerce advantage remain?
Global Alpha insights: QXO's recipe for steady compounding
An $800bn analogue industry meets operational discipline.
What's your growth flavour?
Three investment managers. Three different approaches to growth investing. But can all of them be right?
Don’t burn your boats: investing in AI
Why we’re ruthlessly selective about AI-related stocks.
Global Alpha Q4 investor letter
The Global Alpha Team reflects on recent performance, portfolio changes and market developments.
Global Alpha Q4 update
Investment specialist Ben Drury reflects on recent performance, portfolio changes and market developments.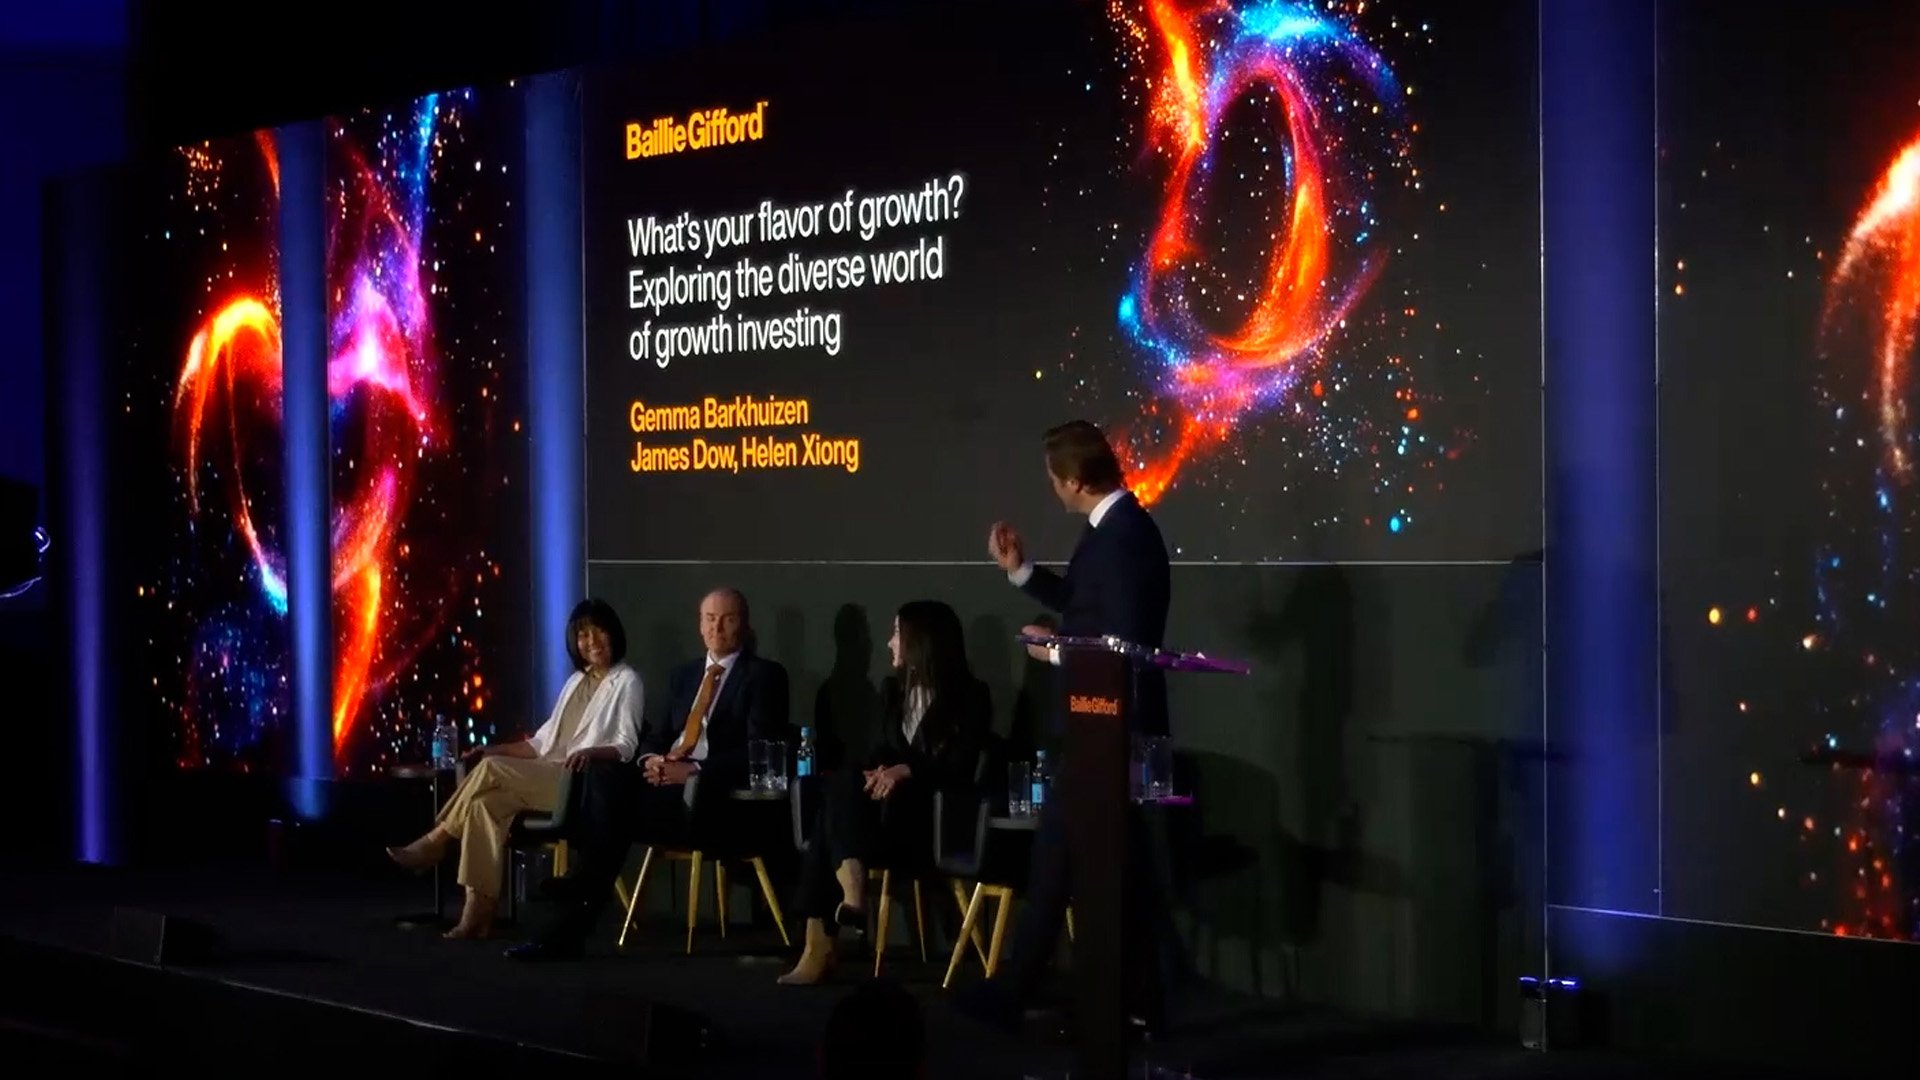
What’s your flavour of choice?
Three investment managers debate growth strategies from tech disruption to steady compounders
Global Alpha Research Agenda 2025
From AI to emerging consumers, we focus on the growth areas and companies capitalising on opportunities.
Global Alpha insights: our reliable growth engine
Not flashy, just dependable. Why compounders remain the engine of durable long-term returns.
Amazon: Stock Story
Jon Henry gives three key reasons why tech giant Amazon remains a special investment.
Adyen: Stock Story
Beatrice Faleri explores Adyen, the one-platform engine for unified commerce.
TSMC: Stock Story
Qian Zhang unwraps TSMC, the company powering modern life.
Global Alpha insights: the grid for growth
AI’s massive electricity needs create compelling investment opportunities.
Global Alpha Q3 update
Investment manager Michael Taylor reflects on recent performance, portfolio changes and market developments.
Global Alpha Q3 investor letter
The Global Alpha Team reflects on recent performance, portfolio changes and market developments.
Global Alpha insights: the future of finance
Coinbase is reshaping finance by uniting digital assets, stablecoins and trust.
Salesforce: putting AI agents to work
Agentforce’s promise of handling customer service 24/7, faster and at a lower cost.
Global Alpha insights: onsemi
How the chip maker reinvented itself from ugly duckling to industry leader.
Global Alpha Q2 investor letter
The Global Alpha Team reflects on recent performance, portfolio changes and market developments.
Global Alpha Q2 update
Investment manager Helen Xiong reflects on recent performance, portfolio changes and market developments.
Uncommon understanding
Global Alpha’s investment managers reveal how they spot what others don’t see.
Global Alpha insights: infrastructure
Why companies like Martin Marietta are set to benefit from increased spending on infrastructure.
Global Alpha: introducing Michael Taylor
Investment manager Michael Taylor joins Global Alpha as a decision-maker. We explore his background, strengths, and vision for the portfolio’s future opportunities.
Global Alpha insights: turbulent times
How can we participate in long-term progress without it being undone by every policy turn?
Alnylam: Stock Story
Richie Vernon explores the revolutionary drugs transforming patient lives.
Global Alpha Q1 update
The Global Alpha Team reflects on recent performance, portfolio changes and market developments.
Global Alpha Q1 investor letter
The Global Alpha Team reflects on recent performance, portfolio changes and market developments.
Global Alpha insights: a time to trade?
Explore how we're evolving the portfolio as the investment environment enters a period of rapid change.
Cloudflare: Stock Story
Ben James highlights how one cybersecurity approach is redefining digital infrastructure.
Nexans: Stock Story
Lucy Haddow examines the sub-sea cable manufacturer crucial for the offshore wind and energy transition.
Atlas Copco: Stock Story
Ben Drury explores how a culture of innovation and decentralisation drives success in industrial technology.
Moutai: Stock Story
Ben Buckler investigates the Chinese brand dominating the global luxury drinks market.
DoorDash: delivering the goods
How DoorDash’s ambitions extend far beyond restaurant deliveries.
Global Alpha Insights: investing in resilience beyond political cycles
Why the Global Alpha Team believes elections don't impact stock market returns.
Global Alpha Q4 investor letter
The Global Alpha Team reflects on recent performance, portfolio changes and market developments.
Global Alpha insights: Rakuten and the 'Dog Shogun'
Richie Vernon, investment specialist, explains why the Global Alpha Team has a different perspective on Rakuten's future market growth.
Why growth investors can’t ignore China
China’s electric car, battery and other advanced manufacturers are on the rise.
Global Alpha insights: unlocking the magic of Disney
Why the Global Alpha Team believes there is a magical journey ahead for Disney.
Our best ideas in the US
Ben James explains why DoorDash, The Trade Desk and CoStar stand out as growth stocks in the US.
Eric Beinhocker: evolutionary economist
How successful companies harness the power of adaptation.
Kweichow Moutai: spirit of China
The fiery spirit that’s a profitable symbol of Chinese culture and luxury.
Beyond NVIDIA: investing in semiconductors
Why some of the leading computer chip makers and companies enabling them have room to grow.Global Alpha Research Agenda
From AI to infrastructure – Global Alpha homes in on the growth areas and companies best placed to exploit opportunities.
Global Alpha: back to growth
The managers tell a London Investment Forum about new sources of opportunity and optimism.
Global Alpha Research Agenda 2023
How can we invest in quality companies with the potential to generate sustainable returns in a changing market?
Digital Disruption and the future
Online infrastructures and digital developments in the education, energy, and transport sectors make for an exciting future.
Global Alpha 2022 Research Agenda
In their Research Agenda for 2022, the investment managers consider the benefits of deep work in helping them find growth opportunities.
Harnessing growth for the next decade
Investment manager Malcolm MacColl and Senior Governance and Sustainability Analyst Kieran Murray outline believed growth drivers and the development of Global Alpha’s ESG process.
Highlights Video: Harnessing growth for the next decade
Watch the highlights from the recent Global Alpha webinar: Harnessing growth for the next decade.
Global Alpha Paris-Aligned
The Global Alpha Paris-Aligned portfolio offers a pathway for clients to align their assets with the objectives of the Paris Agreement. Here, we provide some background to the Paris Accords and outline how we aim to implement its objectives.
The importance of looking forward
This recording has been prepared for professional investors and is not for further distribution. Baillie Gifford takes no responsibility for the reliance on this recording by any other person who did not receive this recording from Baillie Gifford.
Global Alpha research agenda
In this year’s Research Agenda, Global Alpha’s investment managers share their thoughts on how change can help shape the portfolio.
Global Alpha - 10 minutes with Helen Xiong
Ben Drury, client director, talks to Helen Xiong, an investor and soon-to-be key decision-maker for the Global Alpha strategy.
Back to the future
This webinar has been prepared solely for the use of professional investors outside of the Unites States and is not for further distribution. Baillie Gifford takes no responsibility for the reliance on this webinar by any other person who did not receive this webinar from Baillie Gifford.
Global Alpha Q2 investor letter
The Global Alpha Team reflects on recent performance, portfolio changes and market developments.Medpace: easing the bottleneck in drug development
Why Global Alpha sees Medpace as part of drug development’s essential infrastructure.Global Alpha Q2 update
Investment specialist Ben Drury reflects on recent performance, portfolio changes and market developments.Global Alpha Forum: the changing growth opportunity set
How Global Alpha is seeking growth across companies, regions and real-world constraints.Stock story: Sea Limited
Amy Leishman examines Sea’s role in Southeast Asia’s changing digital economy.Stock markets: ecology and evolution
Why capital flows and market narratives are changing how global markets behave.The big squeeze: bottlenecks as advantage
When demand outstrips supply, companies that sit astride the pinch point can gain an enduring edge.AI: valuing scarcity
AI is creating new abundance and shifting bottlenecks. We explore which businesses can win in the long term.Global Alpha Q1 investor letter
The Global Alpha Team reflects on recent performance, portfolio changes and market developments.Global Alpha Q1 update
Investment manager Malcolm MacColl reflects on recent performance, portfolio changes and market developments.AI is coming for your mind
AI is reshaping human cognition. What does that mean for workers, companies and society?Global Alpha insights: agentic commerce
As AI simplifies shopping, where does durable ecommerce advantage remain?Global Alpha insights: QXO's recipe for steady compounding
An $800bn analogue industry meets operational discipline.What's your growth flavour?
Three investment managers. Three different approaches to growth investing. But can all of them be right?Don’t burn your boats: investing in AI
Why we’re ruthlessly selective about AI-related stocks.Global Alpha Q4 investor letter
The Global Alpha Team reflects on recent performance, portfolio changes and market developments.Global Alpha Q4 update
Investment specialist Ben Drury reflects on recent performance, portfolio changes and market developments.What’s your flavour of choice?
Three investment managers debate growth strategies from tech disruption to steady compoundersGlobal Alpha Research Agenda 2025
From AI to emerging consumers, we focus on the growth areas and companies capitalising on opportunities.Global Alpha insights: our reliable growth engine
Not flashy, just dependable. Why compounders remain the engine of durable long-term returns.Amazon: Stock Story
Jon Henry gives three key reasons why tech giant Amazon remains a special investment.Adyen: Stock Story
Beatrice Faleri explores Adyen, the one-platform engine for unified commerce.TSMC: Stock Story
Qian Zhang unwraps TSMC, the company powering modern life.Global Alpha insights: the grid for growth
AI’s massive electricity needs create compelling investment opportunities.Global Alpha Q3 update
Investment manager Michael Taylor reflects on recent performance, portfolio changes and market developments.Global Alpha Q3 investor letter
The Global Alpha Team reflects on recent performance, portfolio changes and market developments.Global Alpha insights: the future of finance
Coinbase is reshaping finance by uniting digital assets, stablecoins and trust.Salesforce: putting AI agents to work
Agentforce’s promise of handling customer service 24/7, faster and at a lower cost.Global Alpha insights: onsemi
How the chip maker reinvented itself from ugly duckling to industry leader.Global Alpha Q2 investor letter
The Global Alpha Team reflects on recent performance, portfolio changes and market developments.Global Alpha Q2 update
Investment manager Helen Xiong reflects on recent performance, portfolio changes and market developments.Uncommon understanding
Global Alpha’s investment managers reveal how they spot what others don’t see.Global Alpha insights: infrastructure
Why companies like Martin Marietta are set to benefit from increased spending on infrastructure.Global Alpha: introducing Michael Taylor
Investment manager Michael Taylor joins Global Alpha as a decision-maker. We explore his background, strengths, and vision for the portfolio’s future opportunities.Global Alpha insights: turbulent times
How can we participate in long-term progress without it being undone by every policy turn?Alnylam: Stock Story
Richie Vernon explores the revolutionary drugs transforming patient lives.Global Alpha Q1 update
The Global Alpha Team reflects on recent performance, portfolio changes and market developments.Global Alpha Q1 investor letter
The Global Alpha Team reflects on recent performance, portfolio changes and market developments.Global Alpha insights: a time to trade?
Explore how we're evolving the portfolio as the investment environment enters a period of rapid change.Cloudflare: Stock Story
Ben James highlights how one cybersecurity approach is redefining digital infrastructure.Nexans: Stock Story
Lucy Haddow examines the sub-sea cable manufacturer crucial for the offshore wind and energy transition.Atlas Copco: Stock Story
Ben Drury explores how a culture of innovation and decentralisation drives success in industrial technology.Moutai: Stock Story
Ben Buckler investigates the Chinese brand dominating the global luxury drinks market.DoorDash: delivering the goods
How DoorDash’s ambitions extend far beyond restaurant deliveries.Global Alpha Insights: investing in resilience beyond political cycles
Why the Global Alpha Team believes elections don't impact stock market returns.Global Alpha Q4 investor letter
The Global Alpha Team reflects on recent performance, portfolio changes and market developments.Global Alpha insights: Rakuten and the 'Dog Shogun'
Richie Vernon, investment specialist, explains why the Global Alpha Team has a different perspective on Rakuten's future market growth.Why growth investors can’t ignore China
China’s electric car, battery and other advanced manufacturers are on the rise.Global Alpha insights: unlocking the magic of Disney
Why the Global Alpha Team believes there is a magical journey ahead for Disney.Our best ideas in the US
Ben James explains why DoorDash, The Trade Desk and CoStar stand out as growth stocks in the US.Eric Beinhocker: evolutionary economist
How successful companies harness the power of adaptation.Kweichow Moutai: spirit of China
The fiery spirit that’s a profitable symbol of Chinese culture and luxury.Beyond NVIDIA: investing in semiconductors
Why some of the leading computer chip makers and companies enabling them have room to grow.Global Alpha Research Agenda
From AI to infrastructure – Global Alpha homes in on the growth areas and companies best placed to exploit opportunities.Global Alpha: back to growth
The managers tell a London Investment Forum about new sources of opportunity and optimism.Global Alpha Research Agenda 2023
How can we invest in quality companies with the potential to generate sustainable returns in a changing market?Digital Disruption and the future
Online infrastructures and digital developments in the education, energy, and transport sectors make for an exciting future.Global Alpha 2022 Research Agenda
In their Research Agenda for 2022, the investment managers consider the benefits of deep work in helping them find growth opportunities.Harnessing growth for the next decade
Investment manager Malcolm MacColl and Senior Governance and Sustainability Analyst Kieran Murray outline believed growth drivers and the development of Global Alpha’s ESG process.Highlights Video: Harnessing growth for the next decade
Watch the highlights from the recent Global Alpha webinar: Harnessing growth for the next decade.Global Alpha Paris-Aligned
The Global Alpha Paris-Aligned portfolio offers a pathway for clients to align their assets with the objectives of the Paris Agreement. Here, we provide some background to the Paris Accords and outline how we aim to implement its objectives.The importance of looking forward
This recording has been prepared for professional investors and is not for further distribution. Baillie Gifford takes no responsibility for the reliance on this recording by any other person who did not receive this recording from Baillie Gifford.Global Alpha research agenda
In this year’s Research Agenda, Global Alpha’s investment managers share their thoughts on how change can help shape the portfolio.Global Alpha - 10 minutes with Helen Xiong
Ben Drury, client director, talks to Helen Xiong, an investor and soon-to-be key decision-maker for the Global Alpha strategy.Back to the future
This webinar has been prepared solely for the use of professional investors outside of the Unites States and is not for further distribution. Baillie Gifford takes no responsibility for the reliance on this webinar by any other person who did not receive this webinar from Baillie Gifford.
Tax and distributions
The Fund intends to pay dividends to its unitholders at least annually. Distributions will be automatically reinvested in additional units of the Fund or, if a unitholder requests, paid directly to unitholder.
The distribution date for the Fund shall be the last Valuation Date in each taxation year or such other frequency as may be determined by the Manager. The distribution dates will appear on this page alongside the rates once they become available. For more information on the Funds distributions please see the Offering Memorandum.
Recent distributions
The below table shows the makeup of the most recent distributions paid.
| Series F | Series Z | |
|---|---|---|
| Income dividends | 0.21847 | 0.23038 |
| Capital gain | 5.90880 | 6.23084 |
| Total per share | 6.12727 | 6.46122 |
| Ex-dividend date | 31 Dec 2025 | 31 Dec 2025 |
| Pay date | 31 Dec 2025 | 31 Dec 2025 |
| Status | Final | Final |
Source: CIBC Mellon and Baillie Gifford & Co.
Upcoming distributions
The table below shows the proposed distribution dates for the current tax year. The dates can be changed by the Officers of the Funds.
Distribution year
2026
Record date
30 December 2026
Ex-dividend date
31 December 2026
Payable date
31 December 2026
Source: CIBC Mellon and Baillie Gifford & Co.