
Key points
- We remain focused on what we are designed to do. By the same token, we are clear about what we must avoid doing
- Company fundamentals remain the dominant determinant of share price returns over the long term
- Our patient investment approach is increasingly different from the market. This presents us with immense opportunities

As with any investment, your capital is at risk.
“Because of our emphasis on the long term, we may make decisions and weigh trade-offs differently.
- We will continue to focus relentlessly on our customers.
- We will continue to make investment decisions in light of long-term market leadership considerations rather than short-term profitability considerations or short-term Wall Street reactions.
- We will continue to learn from both our successes and our failures.
- We will make bold rather than timid investment decisions where we see a sufficient probability of gaining advantages.”
– Jeff Bezos, Amazon 1997 shareholder letter
It has been nearly 30 years since Jeff Bezos penned the lines above in his oft-cited 1997 shareholder letter. He was explicit: results would be volatile, but by deploying a different strategy from most of its peers, Amazon went on to become one of the world’s most successful companies – and one we have held in Long Term Global Growth (LTGG) since 2004.
If Amazon’s temporal mindset was exceptionally unusual among public companies three decades ago, it is even rarer today. Over the years, we have found that the LTGG holdings best able to resist the straitjackets of quarterly earnings cycles and periods of market mania are most likely to be the strongest portfolio performers. The same could be said for investment management.
From decades to days to deciseconds
When we launched LTGG in 2004, our decade-long investment time horizon was about 10 times longer than that of the average market participant. Is it unreasonable to suggest that it could be as high as 100 times longer today?
Market composition has changed markedly over our 22-year history. Back in 2003, more than 80 percent of daily average trading volumes were attributable to long-only, fundamental investors. Today, that number is just 7 percent, having been replaced by rules-based, high-frequency, hedge-fund and retail trading, which collectively comprise 93 percent of average daily traded volumes, which have tripled in the last decade alone.
The average holding periods for these strategies can be as short as fractions of seconds, in an explicit attempt to monetise short-term signals, often around headlines, earnings events, sentiment, or price momentum, meaning that an increasing share of market activity is driven by narratives that spread rapidly and with limited scrutiny.
In February 2026, for example, Algorythm Holdings, a little-known company with a history in manufacturing karaoke equipment, published a white paper asserting that its technology could dramatically increase freight efficiency. Despite the questionable credibility of these claims, the resulting systematic trading triggered billions of dollars in market value losses from companies that were perceived to be victims of Algorythm’s new tools.

Koshiro K – stock.adobe.com
If such a reaction can be provoked by a $5m company with a tenuous proposition, it is unsurprising that markets respond even more forcefully to announcements from credible, large-scale innovators. And so, when Anthropic introduced its new agentic AI system capable of executing complex, multi-step professional tasks, the stock market erased approximately $1tn in value from software-as-a-service (SaaS) companies within days, treating them as a homogeneous group in the so-called “SaaSpocalypse.”
But this is not the only structural shift in the market’s composition, because index funds in the US now command a greater share of equity ownership than actively managed funds. Over the last 20 years or so, net inflows into index mutual funds and index ETFs have exceeded $3tn, while the equivalent active vehicles have seen net outflows of a similar magnitude. As money flows from active strategies into index funds, capital is disproportionately directed toward the largest index constituents, without regard for underlying fundamentals. Far from being ‘passive’ strategies, they reinforce momentum with disproportionate impacts on share prices.
But why does any of this matter to Long Term Global Growth?
Because, as active managers, we need to understand the other participants in the market in order to assess the nature of prevailing inefficiencies. If an increasing share of equity market activity shows little regard for price discovery or fundamentals, those (like us) who optimise for the long term (ie periods of five years or more, over which fundamentals, not algorithms, are the dominant determinant of returns) are likely to be out of step with the market more frequently, more materially, and perhaps over more extended periods of time.
And yet… herein lies our opportunity.
For investors willing to think independently and take the long view, these moments of dislocation form the very foundations of long-term outperformance. Competitive advantages, sustained reinvestment, innovation and growing cash flows will remain the fundamental forces that drive ultimate value creation. And these continue to unfold over decades.
Zooming out on performance
For all of our enthusiasms around the widening market inefficiencies that we can take advantage of in the decades ahead, we recognise that LTGG’s five-year performance figures are now lagging. We want to share our reflections, as well as what we are and aren’t doing about that: what we need to focus on – and what we must stubbornly ignore.
Over the last five years, investors have had to contend with a global pandemic, which gave way to a sharp surge in inflation, followed by the most aggressive monetary tightening cycle in decades; the emergence of a new General Purpose Technology, with the potential to reshape the global economy; and wars in both Europe and the Middle East, adding persistent geopolitical risk. More recently, the closure of the Strait of Hormuz has led to sharp spikes in energy prices, rekindling fears of renewed inflation and slowing global growth.
Such a backdrop has created unusually large dispersions in outcomes across companies, sectors, and styles, with long-duration growth equities experiencing pronounced volatility. As such, the current five-year headline performance figure is dominated by two of the steepest drawdowns in the strategy’s history, which have fallen in close succession, concealing the strong returns delivered between 2023 and 2025.
It is, therefore, worth recalling that since its inception 22 years ago, LTGG has delivered gross annualised returns of 12.7 percent a year (USD) against an index’s 9.2 percent a year.
On a calculator, the return profile looks something like this:
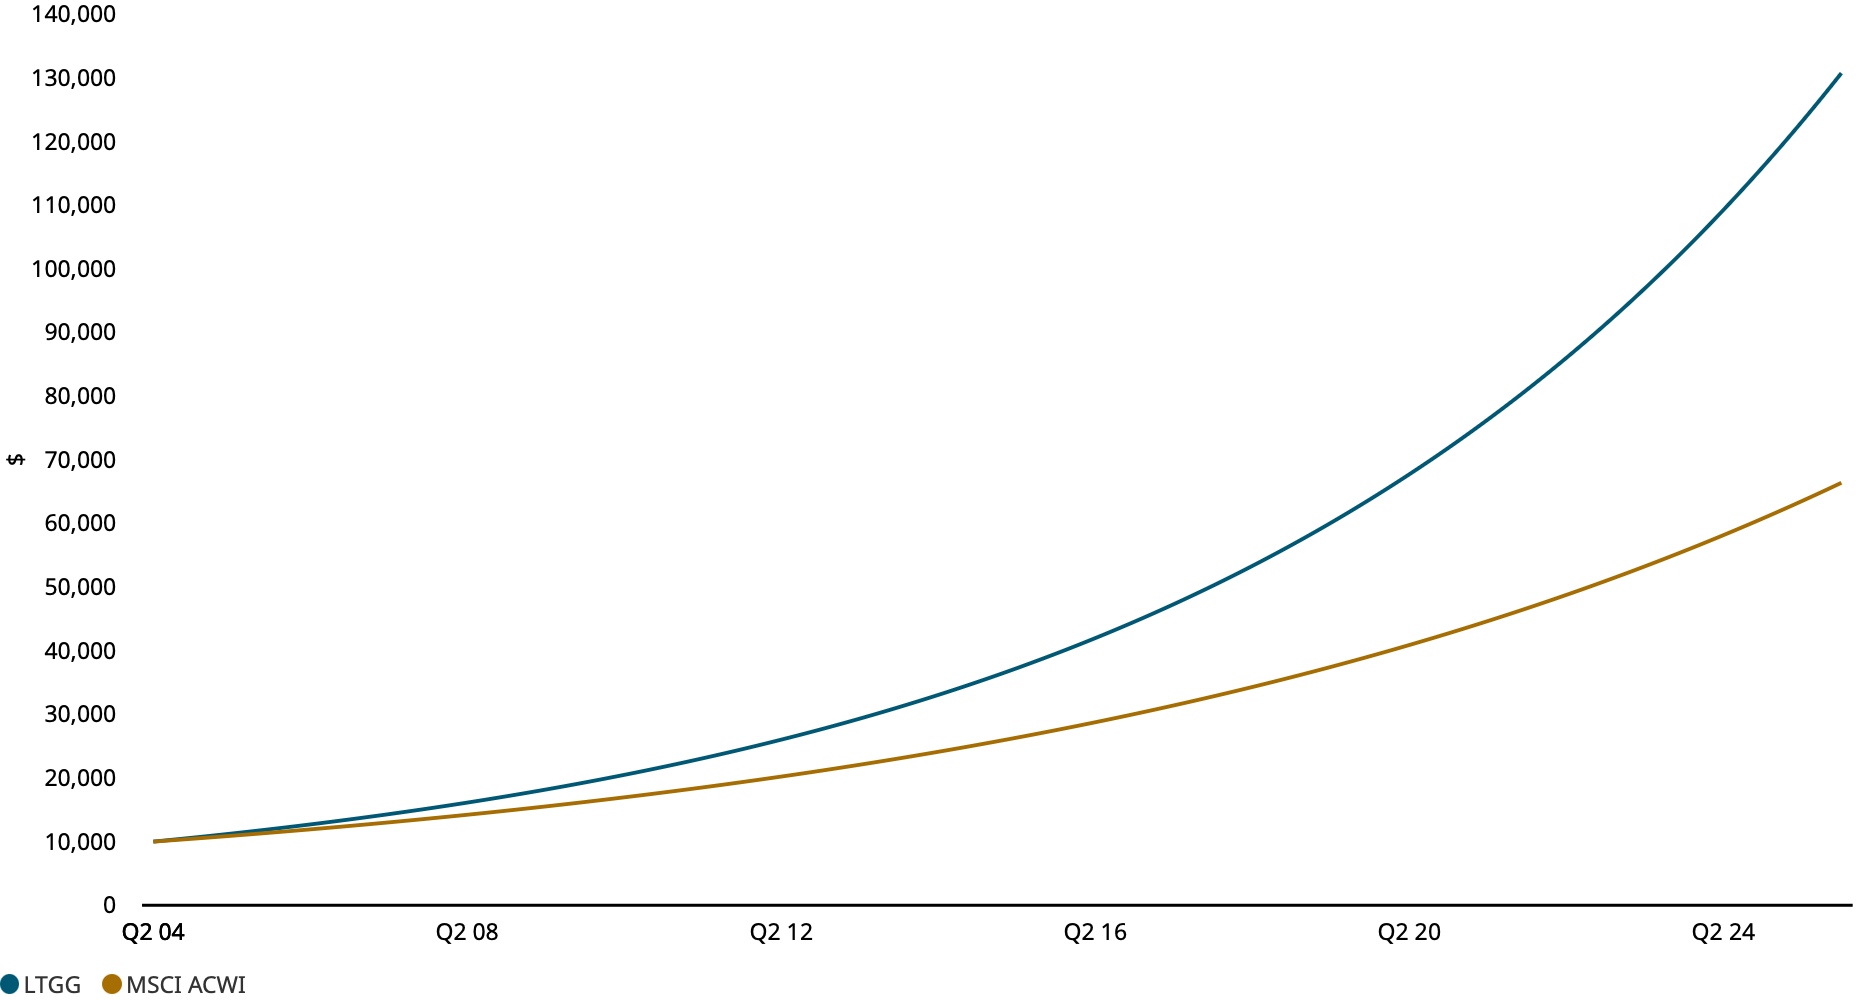
Source: Revolution, MSCI. US dollar. Gross of fees. Long Term Global Growth composite vs MSCI ACWI Index. The LTGG strategy is more concentrated than the MSCI ACWI Index. Graph shows compounding of $10,000 investment, 30 June 2004-31 December 2025.
En route to delivering this performance, we have outperformed the MSCI ACWI in more than 90 percent of five-year rolling periods, and 100 percent of periods of 10 years or more. However, over shorter periods of time, the journey has always been a bumpier one – like this:
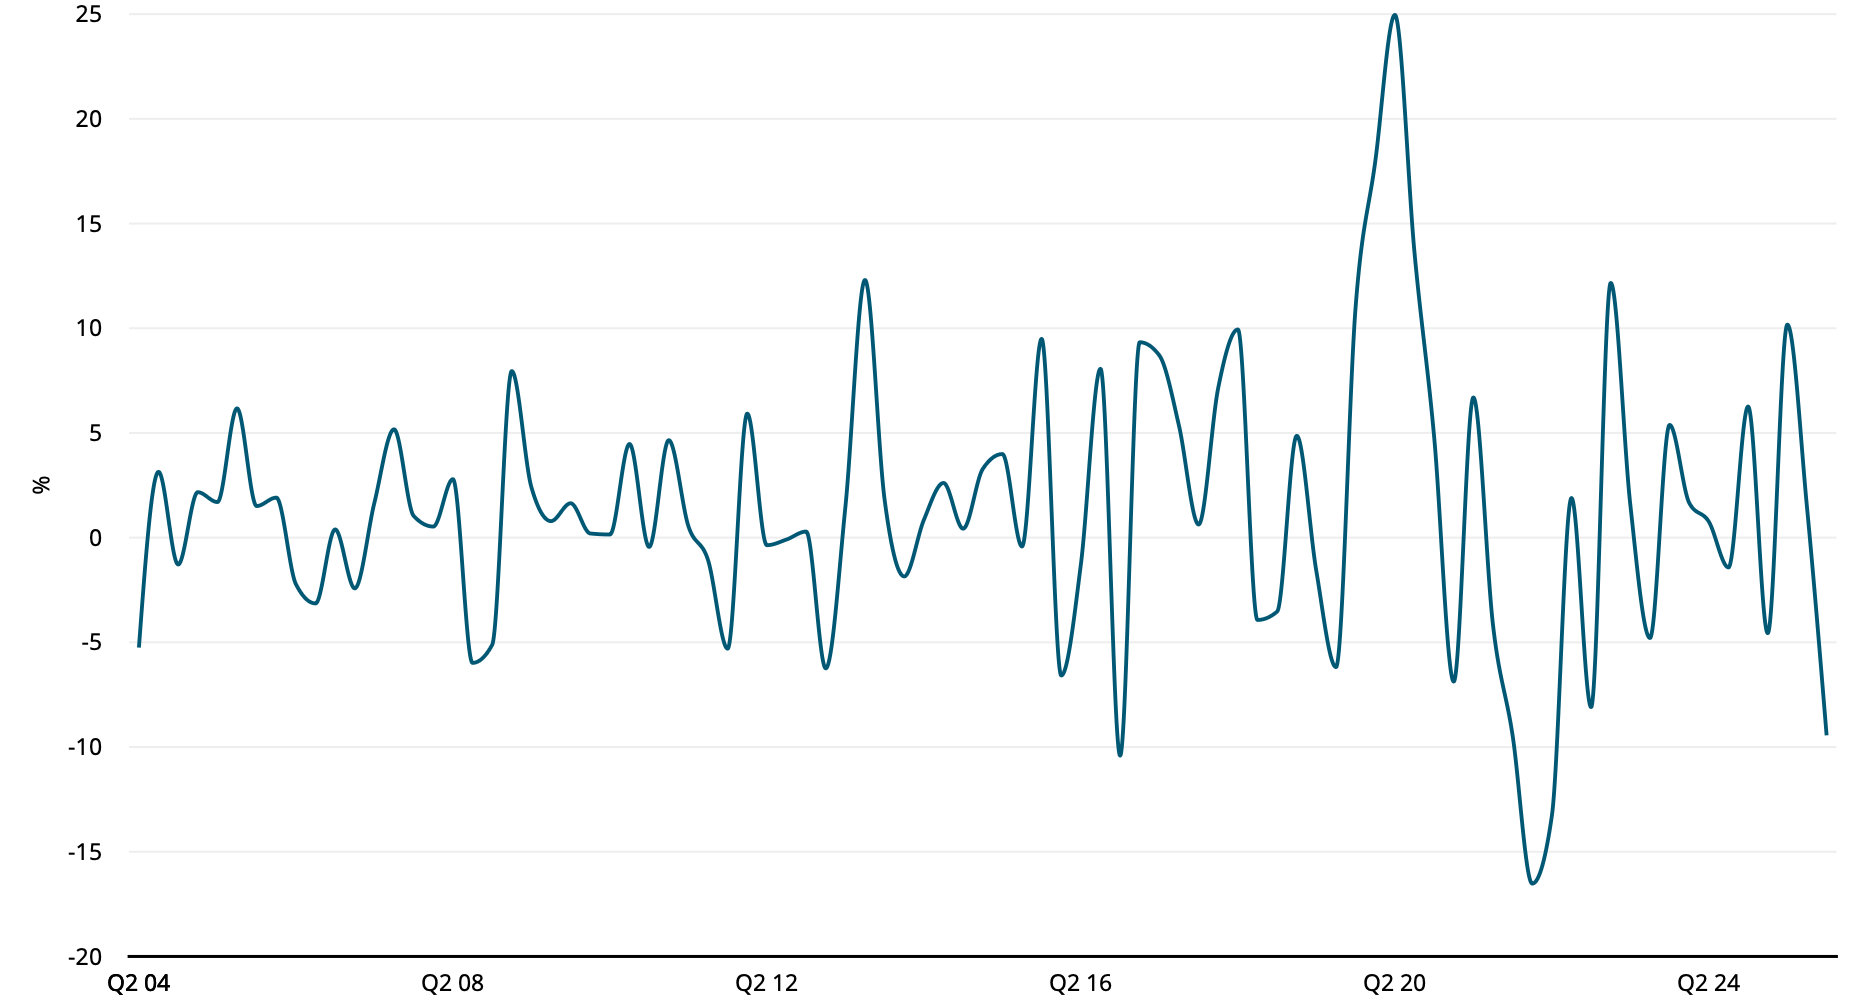
Source: Revolution, MSCI. US dollar. Gross of fees. Long Term Global Growth composite vs MSCI ACWI Index. The LTGG strategy is more concentrated than the MSCI ACWI Index.
The profile of LTGG’s quarterly relative returns is a function of our seeking to outperform by investing in a concentrated portfolio of companies we believe will drive a disproportionate share of long-term equity returns. And in doing so, we must accept that the companies that go on to generate exceptional long-term returns are often among the market’s most volatile along the way, suffering sharp drawdowns and repeated periods of doubt before their fundamental progress is reflected in share prices.
By way of example, the five biggest absolute returners in the strategy have experienced a combined 25 drawdowns greater than 30 percent during our holding period, accompanied by some lurid and very gloomy headlines from the financial media along the way.
History also tells us that the greatest portfolio-level drawdowns have been followed by exceptionally strong recoveries. As illustrated by the chart below:
The biggest drawdown periods have been followed by exceptional returns
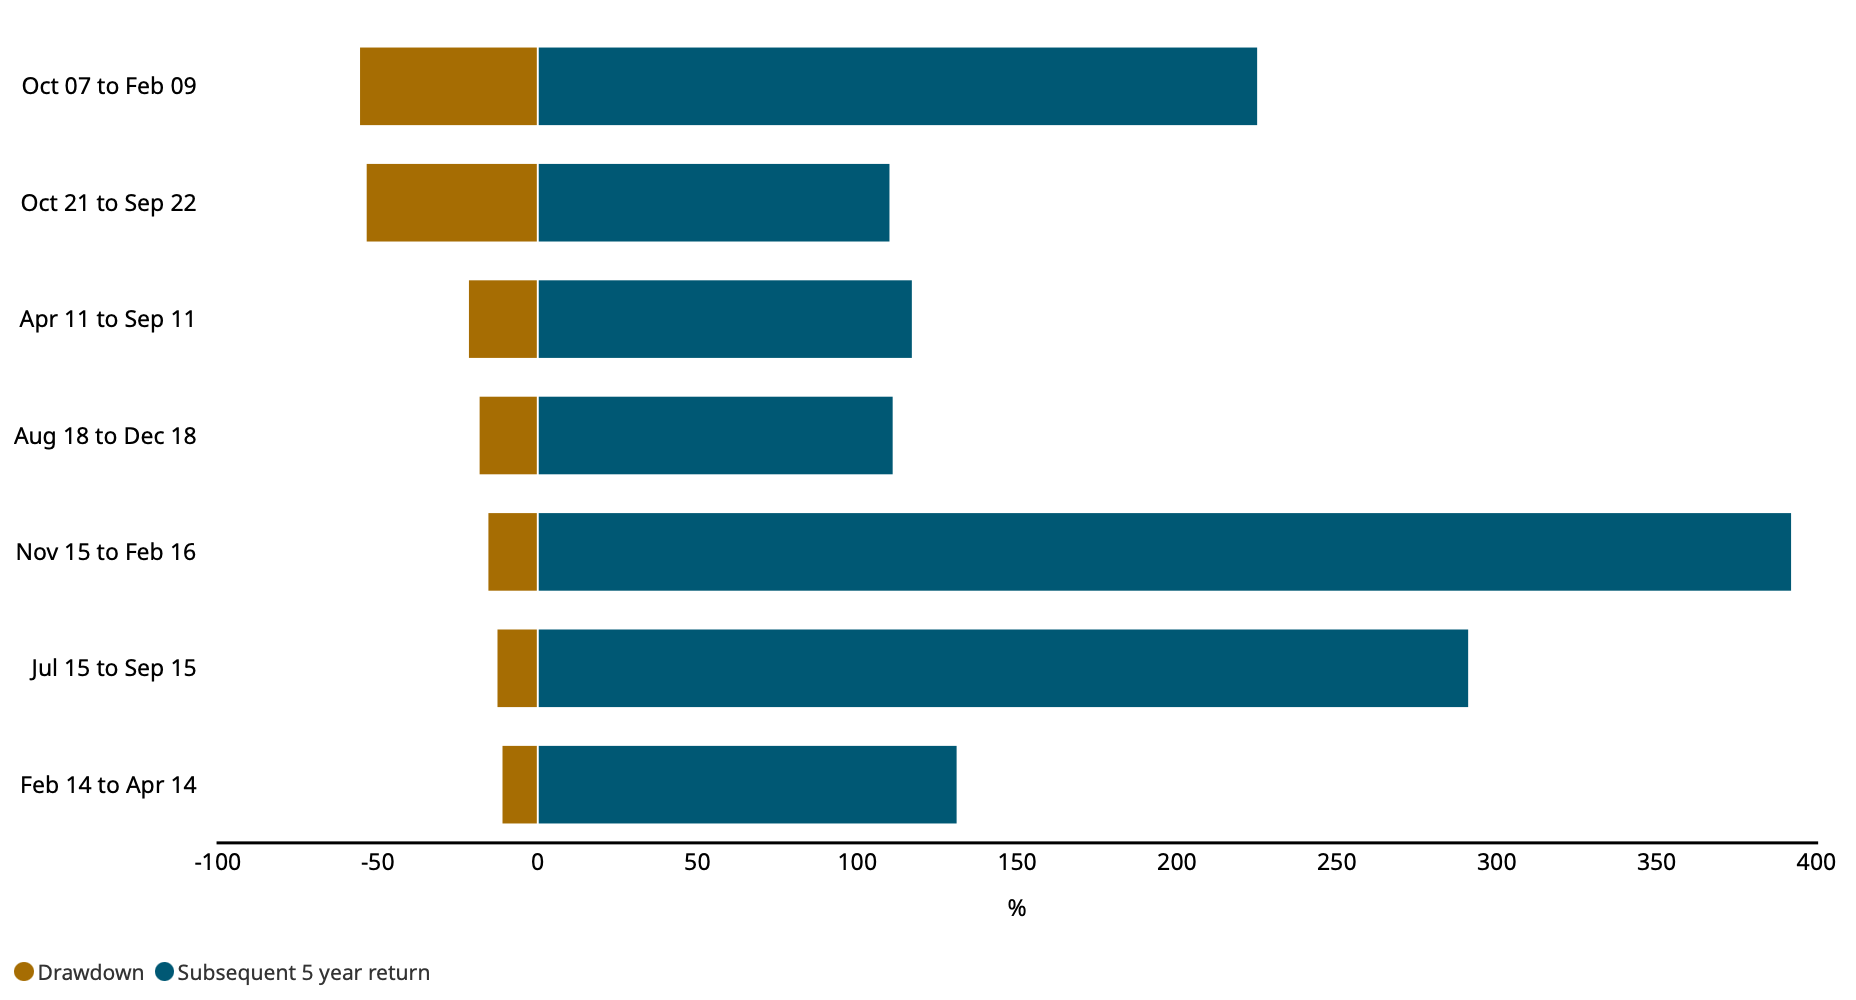
Source: Revolution. US dollar. As at 28 February 2026. LTGG composite drawdowns greater than 10% and their recovery since inception, 29 February 2004.
The current drawdown would be the strategy’s 8th absolute drawdown in excess of 10 percent – that is, one nearly every three years, but the average five-year performance that has followed these periods of discomfort is greater than 200 percent. Time in LTGG, unequivocally, matters more than timing.
So, the relevant question is whether the portfolio is well positioned not only to recover but to outperform following this drawdown, as it has time and again in the past?
What we are focusing on
The hardest and most important battle in portfolio construction and risk management is maintaining clarity about what we are and are not trying to achieve.
LTGG was established 22 years ago as a long-term, benchmark-agnostic strategy, built on the conviction that Baillie Gifford’s partnership structure, growth-investing heritage and fundamental discipline gave us a structural edge in capturing upside on behalf of our clients.
To understand why LTGG is so focused on upside, it helps to recall a simple empirical fact: long-term equity outcomes are highly skewed. A small minority of stocks create the majority of the wealth, many do little, and a meaningful number destroy capital. The distribution is not a bell curve with tidy symmetry. It is lopsided, and it is driven by rare outliers that are volatile and uncomfortable to own.
In fact, Hendrik Bessembinder recently updated his work on the asymmetry of US stock markets. Now covering 100 years, he finds that while shareholders’ wealth increased by $91tn over the century, concentration has increased sharply in the last decade. Only 46 firms, or 0.16 percent of the sample, account for half of the net wealth creation – $45.5tn, revealing roughly twice the concentration observed between 1926 and 2016.
The next two decades look just as promising, given the inefficiencies that we identified back in 2004 are amplifying. Short-termism is becoming more pronounced, not less. The market’s ability to conceptualise compounding is waning, not waxing. Information inputs are narrowing, not widening. Against this backdrop, we must concentrate our efforts on what will drive long-term outperformance.
Identifying superior rates of growth
For all the change we have outlined as having taken place in equity markets, the most consistent determinant of long-term equity returns continues to be earnings growth. This is why, when we assess the current portfolio, the metric we find most instructive is not tracking error or factor exposure, but where our companies sit in the distribution of delivered and future earnings growth.
In that regard, the portfolio has continued to deliver growth materially in excess of the index over the past five years. Even putting NVIDIA’s astronomical 2,708 percent earnings growth aside, CATL, Adyen and Titan are among the companies that have continued to compound earnings in excess of 30 percent a year. Meanwhile, BeOne’s revenue growth of 72 percent a year over the last five years seems to have flown under the radar of most.
Looking ahead, approximately 70 percent of the portfolio by weight sits in the top quintile of consensus forecasts, while valuation premiums to the broader market are at their narrowest in a decade. We own businesses with strong operational momentum at a moment when the market’s willingness to reflect that in share prices is low. This is a strong starting point, as we know that the most reliable predictor of drawdown recovery is also sustained earnings growth.
There are also numerous examples where the future growth potential of holdings is currently underappreciated. Take Samsara, for example, a company that is looking to turn physical operations into data-driven systems. The recent derating in the shares stands in marked contrast to the company’s operational progress. Importantly, the aspects of the investment case that matter most to the long-term upside are strengthening.

Image courtesy of Samsara. The Samsara™ name and logos are trademarks of Samsara, Inc. and its affiliates.
A more targeted sales effort means Samsara is improving its ability to win larger and more sophisticated customers. At the same time, product development remains rapid, with newer offerings increasingly contributing to customer growth and expanding the business well beyond its original core. As such, net new annual recurring revenue has accelerated, and we see scope for meaningful operating leverage from here.
This progress is being overwhelmed by the market’s concerns around imminent AI disruption, despite the fact that Samsara’s hardware products (eg sensors and cameras) are deployed across a vast number of trucks and other physical assets, providing the company with over 24 trillion proprietary data points – a dataset which is incredibly difficult to dislodge. We recently added.
Equally, where earnings prospects aren’t looking as favourable, we recycle capital elsewhere. We funded the addition to Samsara by reducing Netflix. We view its aborted bid to acquire Warner Bros. as a signal that organic growth is becoming more challenging, and likely more expensive.
As our confidence in Netflix’s ability to achieve faster growth and higher returns has diminished, we have reduced the position size. There are also examples in the portfolio where share prices have seen significant drawdowns, such as Atlassian and Duolingo, where we are pausing to determine the range of outcomes from here.
Remaining open-minded about sources of growth
Superior, sustained earnings growth is the driver of asymmetric equity returns, but the sources of that growth are not singular. Our own history demonstrates how varied outliers can be, from luxury goods brand Hermès to industrial manufacturer Atlas Copco and the Chinese platform Tencent.
This is why, despite the portfolio’s active concentration, its growth drivers are deliberately broad. Today, the portfolio already spans flying taxis, law-enforcement operating systems and Chinese battery technology.
The open-mindedness to recognise when the next generation of winners is beginning to take shape is as important to LTGG as the patience to hold exceptional businesses through periods of doubt. The companies that will drive the next decade of returns are unlikely to be the ones the market is already focused on.
A handful of exceptional holdings can shape an entire strategy’s outcome
| Holding period return (%) | Index weight at purchase (%)* | |
| NVIDIA | 12,048 | 0.2 |
| Amazon | 10,301 | 0.04 |
| Tesla | 7,796 | 0.05 |
| Hermès | 4,429 | 0.02 |
| Tencent | 3,226 | 0.07 |
Source: Revolution. US dollar. As at 28 February 2026. *Weights for Amazon, Hermès and Tesla are at the first available date.
This is why we are ensuring that the funnel of ideas remains sufficiently wide, while actively resisting any narrowing of ambition that can quietly take hold during periods of underperformance.
Recent discussions have ranged across Zijin Mining (commodities mining), Global-E (cross-border ecommerce), Minimax (Chinese AI), Robinhood (retail financial services), in addition to revisiting former holdings Nintendo (gaming) and Alphabet (technology conglomerate), as we intend to take full advantage of our unconstrained mandate, as we have historically. Though rest assured that we won’t be compromising on either the quality of company or longevity of the opportunity for reasons of perceived risk reduction.
Our recent purchase of MakeMyTrip further broadens the portfolio’s exposure to distinct growth engines. As the dominant online travel agency in India, MakeMyTrip represents a high-quality, long-duration royalty on the structural rise of the Indian middle class.
Just as importantly, its adaptability has been tested, with earlier periods of intense competition reinforcing how difficult it is to dislodge. The stock has derated sharply as air travel volumes have faced headwinds from supply constraints, which we view as transient. The 40 percent drawdown between our discussion and taking a position in the portfolio made an already compelling long-term case considerably more attractive.
Continuously enhancing the inputs to our research
As many market participants increasingly focus on shorter-term signals, we are going the other way. We continue to harness different sources of insight and expertise, both external and internal to Baillie Gifford, to assist us – and challenge us – in the task of stock selection and portfolio construction.
Baillie Gifford's growing private markets capability, for example, provides a distinct vantage point. Our exposure to private AI pioneers such as Anthropic and Databricks, alongside ongoing dialogue with participants across the AI ecosystem, including OpenAI and Thinking Machines, has given us a more nuanced understanding of how value may accrue from this technological transition.
Our Shanghai office extends that advantage into one of the most dynamic and frequently misunderstood investment environments in the world.
During our trip earlier this year, we spent time with the founders of local LLM companies Moonshot AI, Zhipu and Minimax. We heard first-hand how trade restrictions have deprived China’s AI ecosystem of access to leading-edge hardware like ASML’s lithography machines or the latest generation of NVIDIA GPUs, and the impressive workarounds that have been deployed.
The access we have to management teams is likely to become even more valuable as AI further commoditises information. The insights that flow from years of relationship-building are not the inputs that drive the majority of market activity (given the short-term nature of most participants), and yet over our time horizon they are likely to prove among the most consequential.
That scarce access, earned over decades, should become more valuable, not less. Which is why we continue to prioritise spending time with companies building the future and ensure we are asking the relevant questions.
Baillie Gifford’s Investment Risk, Analytics and Research team also provides important input. For example, by complementing our Euler diagram, a visual and qualitative mapping of the portfolio’s distinct growth drivers, with a quantitative mapping of the portfolio’s underlying correlations.
This helps us consider questions such as: are concentrations deliberate or accidental? How might the portfolio behave under different liquidity regimes? Are we unknowingly clustered in exposures that look diversified by our labelling but are highly correlated in economic reality?
In practice, this is one of the many inputs that helps inform trading decisions such as our recent additions to AppLovin (mobile advertising) and Reddit (community-driven platform), funded by a complete sale of The Trade Desk (programmatic advertising platform). All three have been caught in similar market narratives around software and advertising, but we think the underlying investment cases have diverged.

Image courtesy of Reddit, Inc. © 2025. All rights reserved.
AppLovin and Reddit continue to execute strongly, and in both cases, the market has given us the chance to add to higher-conviction businesses at more attractive valuations. By contrast, The Trade Desk’s investment case has been frayed by idiosyncratic execution missteps and governance concerns over the past year.
This was therefore not an exercise in broad de-risking, but in selective capital recycling: maintaining exposure to an attractive area of growth (digital advertising) while improving the quality of that exposure.
Interacting with any investment risk team, however, is not without its risks. The potential trap, particularly during periods of underperformance, is that it curbs risk-taking and thereby leads to style drift. And the risk of low risk would be immensely damaging to LTGG, particularly amidst some of the most exciting market dislocations that we’ve seen in a decade. Bringing us on to…
What we must avoid
The modern financial system is rich with tools designed to forecast, quantify and constrain downside outcomes. Volatility models, Value-at-Risk frameworks, stress tests, scenario analyses and factor decompositions all promise, in different ways, to bring the extreme into the measurable and keep portfolios anchored to the benchmark’s behaviour. In part because being too different is often synonymous with being too difficult to defend.
It is tempting to believe that large losses, sharp drawdowns and sudden dislocations can be engineered away with sufficient sophistication, yet the academic literature is clear on one uncomfortable point: delivered risk frequently diverges from predicted risk.
Anchoring off the past
Most risk systems are calibrated on historical data. They assume that the statistical properties of returns – correlations, volatilities, tail behaviour – are sufficiently stable to extrapolate into the near future. In quiet markets, that assumption can hold tolerably well. In periods of structural change, it breaks down. In fact, Bessembinder’s work on whether objectively measurable characteristics can forecast extreme stock outcomes concludes that, while some statistically significant patterns exist, more than 98 per cent of the variation in outcomes remains unexplained.
When inflation re-emerges after decades of dormancy, when policy regimes shift abruptly, or when a new technological cycle changes sectoral leadership, the historical relationships embedded in risk models can become misleading. Correlations that appeared low can converge. Assets that looked diversified can move together. Volatility that appeared contained can gap. Precisely as we witnessed in 2022, when interest rates rose sharply, and again through 2025 and into 2026, as the strongest value rotation in a generation has been further intensified by risk-off trading.
Likewise, one of the most dangerous assumptions in investing is that stability can be found in companies deemed ‘safe’. Time and again, real capital destruction has come from incumbents whose earnings and valuations were built on the illusion of permanence. From Blockbuster to Nokia and Kodak, these supposed safe havens can also be the most exposed when technological change accelerates. They suffer a double blow: earnings erode as their models are disrupted, and valuations compress as the market recognises they were never as dependable as assumed.
Buckling to procyclical temptations
The greater concern, however, is that risk models can encourage treacherously procyclical portfolio construction. When volatility spikes and a large share of capital managed to the same metrics reduces exposure simultaneously to comply with risk limits, the resultant selling can increase volatility further. When correlations rise, and risk budgets tighten, portfolios can be forced to de-risk at precisely the moment prices are weakest and prospective returns are highest. The collective response amplifies the very risks it seeks to control.
A benchmark-relative risk assessment memorably flagged the risk of LTGG being dangerously underweight banks in 2007, shortly before the Global Financial Crisis. Similarly, such frameworks highlighted the egregious omission of Novo Nordisk (which has since seen a 75 per cent drawdown from its peak) from the LTGG portfolio as hurting our relative performance in 2023. No doubt, our current minerals underweight is hurting us, when gold, silver and copper prices have all spiked. But such relative considerations have never, and will never, affect our approach to portfolio construction.
We are unwavering in our conviction that tracking error is not a measure of the probability of permanent impairment. It is a measure of difference from an index. Factor deviation is also not a verdict on the soundness of the underlying businesses. It is a backwards-looking description of how the portfolio’s exposures compare to a reference portfolio that was not designed around our objective, and as we have explored, is increasingly determined by actors with vastly different priorities.
The subtle danger is that these measures, if acted upon, encourage benchmark anchoring, quietly turning risk control into a commitment to underwrite yesterday’s success while rationing capital away from the companies that might define tomorrow.
This is how the real risk for LTGG, that of missing outliers (by never owning, undersizing or selling too early), can creep in without anyone calling it that. It arrives not as a single catastrophic decision but as a series of small concessions to what feels defensible in the moment: trimming what is volatile, adding what is benchmark-heavy, ‘de-risking’ when deviation becomes uncomfortable, and building a portfolio that can always be explained, even if it can no longer surprise.
Losing sight of our edge
None of this argues that we should ignore downside risk. On the contrary, it argues for humility about our ability to engineer it away. And a recognition that even if we were to achieve perfection in this very (and increasingly) challenging endeavour, we would not improve our odds of delivering on our mandate. That mandate is predicated on identifying and holding outliers early, which is directly at odds with minimising downside risk.
Instead, by honing our fundamental analysis – where we have shown deliverable edge – and maintaining exposure to a broad set of growth drivers, we aim for an asymmetry in which upside capture more than compensates for downside risk.
LTGG’s edge is not simply analytical. It is structural and behavioural. We are able to maintain a differentiated approach because of the shared long-termism, and resulting alignment between us, our clients and the companies that we invest in.
As such, our opportunity increasingly lies where others are constrained: in companies whose long-term prospects remain strong, but whose share prices are volatile; whose recent performance is weak; whose business leaders defy conventional management practices; or whose path to value realisation is too long for most managers to tolerate.
As more of the market is pushed toward shorter horizons, the scarcity value of patient, conviction-led capital should rise.
Deviation as differentiation
The market’s growing fixation on short-term signals does not alter how enduring value is created; it simply makes the link between operational progress and share price recognition more erratic. In this environment, portfolios constructed to resemble the benchmark may feel reassuring, but they risk losing the ability to own the businesses that will define the next decade.
For LTGG, the relevant question is not whether volatility can be reduced, but whether reducing it would enhance our ability to capture the small number of companies that drive long-term equity returns. The evidence suggests not.
Our task, therefore, is not to eliminate uncertainty but to bear it selectively, where asymmetry is greatest and underlying fundamentals are strengthening. This demands discipline: a sustained focus on business fundamentals, openness to where growth may emerge and a willingness to resist the persistent pressures to conform.
LTGG was built to take advantage of these growing inefficiencies. Different by design, but always in service of a clear objective: delivering outsized long-term returns for our clients. Like Amazon in 1997, the path is unlikely to be smooth, and the trade-offs will not always be comfortable. But for those willing to stay the course, it remains the route to exceptional long-term outcomes.
Annual past performance to 31 March each year (%)
| 2022 | 2023 | 2024 | 2025 | 2026 | |
| Long Term Global Growth Composite (gross) | -17.5 | -17.5 | 27.1 | 8.5 | 5.0 |
| Long Term Global Growth Composite (net) | -18.1 | -18.1 | 26.2 | 7.7 | 4.3 |
| MSCI ACWI Index | 7.7 | -7.0 | 23.8 | 7.6 | 20.5 |
Annualised returns to 31 March 2026 (%)
| 1 year | 5 years | 10 years | |
| Long Term Global Growth Composite (gross) | 5.0 | -0.3 | 15.4 |
| Long Term Global Growth Composite (net) | 4.3 | -1.0 | 14.6 |
| MSCI ACWI Index | 20.5 | 10.0 | 11.9 |
Source: Revolution, MSCI. US dollars. Net returns have been calculated by reducing the gross return by the highest annual management fee for the composite. 1 year figures are not annualised.
Past performance is not a guide to future returns.
Legal notice: MSCI makes no express or implied warranties or representations and shall have no liability whatsoever with respect to any MSCI data contained herein. The MSCI data may not be further redistributed or used as a basis for other indexes or any securities or financial products. This report is not approved, endorsed, reviewed or produced by MSCI. None of the MSCI data is intended to constitute investment advice or a recommendation to make (or refrain from making) any kind of investment decision and may not be relied on as such.
Risk factors and important information
The views expressed should not be considered as advice or a recommendation to buy, sell or hold a particular investment. They reflect opinion and should not be taken as statements of fact nor should any reliance be placed on them when making investment decisions.
This communication was produced and approved in April 2026 and has not been updated subsequently. It represents views held at the time of writing and may not reflect current thinking.
Potential for Profit and Loss
All investment strategies have the potential for profit and loss, your or your clients’ capital may be at risk. Past performance is not a guide to future returns.
This communication contains information on investments which does not constitute independent research. Accordingly, it is not subject to the protections afforded to independent research, but is classified as advertising under Art 68 of the Financial Services Act (‘FinSA’) and Baillie Gifford and its staff may have dealt in the investments concerned.
All information is sourced from Baillie Gifford & Co and is current unless otherwise stated.
The images used in this communication are for illustrative purposes only.
Important Information
Baillie Gifford & Co and Baillie Gifford & Co Limited are authorised and regulated by the Financial Conduct Authority (FCA). Baillie Gifford & Co Limited is an Authorised Corporate Director of OEICs.
Baillie Gifford Overseas Limited provides investment management and advisory services to non-UK Professional/Institutional clients only. Baillie Gifford Overseas Limited is wholly owned by Baillie Gifford & Co. Baillie Gifford & Co and Baillie Gifford Overseas Limited are authorised and regulated by the FCA in the UK.
Persons resident or domiciled outside the UK should consult with their professional advisers as to whether they require any governmental or other consents in order to enable them to invest, and with their tax advisers for advice relevant to their own particular circumstances.
Financial Intermediaries
This communication is suitable for use of financial intermediaries. Financial intermediaries are solely responsible for any further distribution and Baillie Gifford takes no responsibility for the reliance on this document by any other person who did not receive this document directly from Baillie Gifford.
10061937