

Key points
- Years of disruption have created a significant disconnect in the UK equity market
- Moonpig and Spirax Sarco show how strong businesses can be missed by the markets
- A standout opportunity in long-term growth companies awaits patient clients while valuations remain low

© chrisjmitchell – stock.adobe.com
As with any investment, your capital is at risk.
The UK equity market has been telling itself a story of decline, discount and disappointment: the exciting companies are elsewhere, the growth is elsewhere, and the future is listed somewhere else.
Like all powerful stories, it contains enough truth to be believable. The UK market has suffered years of weak sentiment, persistent outflows and a stubborn valuation discount. Despite this, last year the FTSE All-Share Index recorded one of its strongest years since the post-global financial crisis rally in 2009.
However, the recovery has been unusually narrow. The index returned 24 per cent in 2025, but just 10 companies generated almost two-thirds of that performance; concentrated in areas such as banking, defence and pharmaceuticals.
Put simply: the mega-caps had a very strong year, and much of the rest of the market was left behind.
That narrowness matters. It has reinforced the idea that the UK is a market for income, cyclicality and defensive ballast rather than one for long-term growth.
It has also obscured a more interesting reality. Beneath the surface sits a collection of companies that are global, innovative, adaptive and capable of sustained strong performance.
The recent divergence between the FTSE 100 and the FTSE 250 illustrates the problem. A small number of large companies have dominated index returns, while a broader range of mid-sized growth businesses has been overlooked.
Over long periods, faster-growing companies in the FTSE 250 have generated significantly higher returns, but that relationship has reversed in recent years.
UK equity large-cap v UK equity mid-cap performance
The opportunity today: strong fundamentals, depressed valuations
This dislocation presents an attractive opportunity in UK growth equities. Across much of the market, and particularly within our UK Alpha and UK Core Growth portfolios, there is a pronounced disconnect between the fundamental earnings power of businesses and their current valuations.
Encouragingly, earnings-per-share growth from high-quality growth companies has reasserted itself relative to more cyclical ‘value’ sectors, many of which have benefited from a short-term uplift in profitability in the aftermath of the Covid pandemic. Share prices, however, have yet to reflect this shift. We do not expect this divergence between fundamentals and valuations to persist indefinitely.
This distinction counts. While share price performance across many companies in our portfolios has been disappointing, the operational performance of the underlying businesses has remained far more resilient, as illustrated in the charts below.
Why this opportunity exists
An exceptional concentration of macroeconomic and geopolitical disruption has marked the past five years. Rather than one isolated shock, markets have absorbed a sequence of overlapping events, each with lasting second-order effects: the pandemic and its policy response, supply chain disruption, inflation, higher interest rates and a more uncertain geopolitical backdrop.
The cumulative effect has been to shorten investor time horizons and increase the premium placed on near-term certainty. Capital has gravitated towards areas offering immediate cash flows, perceived defensiveness or very clear structural tailwinds such as AI-related spending. Longer-duration growth opportunities have been more heavily discounted.
This has resulted in narrow market leadership and a widening dispersion between sectors and investment styles. As long-term investors in high-quality, growth-oriented businesses, the portfolio has been out of step with this environment. This has been the primary driver of our recent underperformance relative to the FTSE All-Share.
Periods like this are part of long-term investing. But the extent of the divergence between share prices and underlying business progress has been striking. That is what creates the opportunity today.
Great British growth companies on offer
Moonpig typifies this opportunity. It is well known as the biggest online greetings card seller in the UK, with a 70 percent share of a growing market. Its valuation has fallen as the market worries about a slowdown in discretionary spending. But what if Moonpig is not a tired UK consumer stock at all, but one of the clearest mispriced digital franchises in the market?
Moonpig has a dominant brand that owns the occasion and a data-science-enabled engine that turns reminders, personalisation and habit into repeat purchase behaviour. While the market is fretting about the UK consumer, Moonpig is quietly building a larger online category. It is attaching gifts to emotionally charged moments, and doing so with rare e-commerce economics: high repeat revenue, low marketing intensity, strong cash generation and disciplined reinvestment. This is not a macro recovery story. It is a structurally advantaged online leader being priced as if it were just another discretionary retailer.
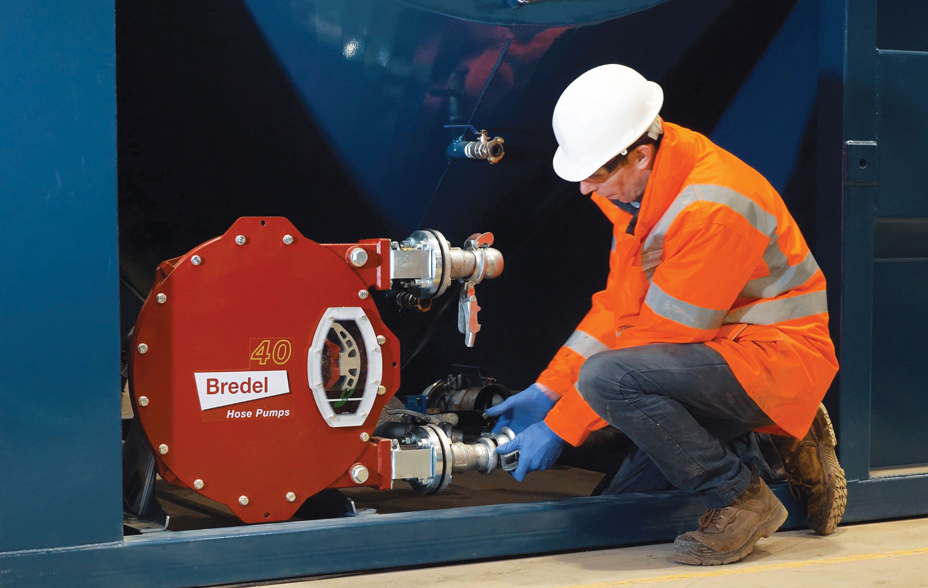
Image supplied courtesy of Spirax Group
Another example of the opportunities now appearing is Spirax Sarco. Its share price has fallen as demand in some of its end markets normalised after the distortions of the pandemic. The market appears to be treating this as a structural problem. We believe it is a cyclical pause for this world-class industrial compounder.
Spirax specialises in niche heat transfer and pumping systems. Its global network of around 2,000 highly skilled sales engineers gives it an unusually strong competitive position: they solve complex customer problems, design bespoke solutions and become embedded in customers’ operations. This creates repeat business, pricing power and high barriers to entry. The result is a business with a long record of organic growth, strong returns and resilient margins. We believe the recent weakness has created an attractive entry point into an exceptional company whose long-term prospects remain intact.
Restoring confidence
Markets have become increasingly driven by shorter-term narratives and narrow leadership. This has created opportunities to invest in high-quality growth businesses at attractive valuations.
The UK market is often overlooked. Yet it offers a diverse range of world-class growth businesses with the potential to provide useful diversification away from increasingly concentrated global equity indices.
Confidence in UK equities has been eroded. We believe it is time to rebuild it. For long-term investors willing to look beyond today’s narrow market leadership, the opportunity in great British growth companies is compelling.
Glossary
Return on invested capital: A measure of how efficiently a company turns the money invested in its business into profits.
Price-to-earnings ratio: A measure of how much investors are paying for each pound of a company’s earnings, often used to judge whether a share looks expensive or cheap.
Past performance
UK Alpha
Annual past performance to 30 June each year (%)
| 2022 | 2023 | 2024 | 2025 | 2026 | |
| UK Alpha Composite (gross) | -39.9 | 23.7 | 2.3 | 17.9 | 2.8 |
| UK Alpha Composite (net) | -40.3 | 23.0 | 1.8 | 17.2 | 2.2 |
| FTSE All Share index* | -10.6 | 12.9 | 12.3 | 20.5 | 18.1 |
Annualised returns to 30 June 2026 (%)
| 1 year | 5 years | 10 years | |
| UK Alpha Composite (gross) | 2.8 | -1.6 | 6.0 |
| UK Alpha Composite (net) | 2.2 | -2.2 | 5.4 |
| FTSE All Share index | 18.1 | 10.0 | 8.6 |
Source: Revolution, FTSE. US dollars. Net returns have been calculated by reducing the gross return by the highest annual management fee for the composite. 1 year figures are not annualised.
UK Core
Annual past performance to 30 June each year (%)
| 2022 | 2023 | 2024 | 2025 | 2026 | |
| UK Core Composite (gross) | -24.4 | 15.4 | 8.9 | 21.4 | 5.5 |
| UK Core Composite (net) | -24.8 | 14.8 | 8.4 | 20.8 | 4.9 |
| FTSE All Share index* | -10.6 | 12.9 | 12.3 | 20.5 | 18.1 |
Annualised returns to 30 June 2026 (%)
| 1 year | 5 years | 10 years | |
| UK Core Composite (gross) | 5.5 | 4.0 | 7.3 |
| UK Core Composite (net) | 4.9 | 3.5 | 6.7 |
| FTSE Core Share index | 18.1 | 10.0 | 8.6 |
Source: Revolution, FTSE. US dollars. Net returns have been calculated by reducing the gross return by the highest annual management fee for the composite. 1 year figures are not annualised.
Past performance is not a guide to future returns.
Legal notice: FTSE International Limited (“FTSE”) © FTSE 2025. “FTSE ®” is a trade mark of the London Stock Exchange Group companies and is used by FTSE International Limited under licence. All rights in the FTSE indices and/or FTSE ratings vest in FTSE and/or its licensors. Neither FTSE nor its licensors accept any liability for any errors or omissions in the FTSE indices and/or FTSE ratings or underlying data and no party may rely on any FTSE indices, ratings and/or data underlying data contained in this communication. No further distribution of FTSE Data is permitted without FTSE’s express written consent. FTSE does not promote, sponsor or endorse the content of this communication.
Risk factors
The views expressed should not be considered as advice or a recommendation to buy, sell or hold a particular investment. They reflect opinion and should not be taken as statements of fact nor should any reliance be placed on them when making investment decisions.
This communication was produced and approved in July 2026 and has not been updated subsequently. It represents views held at the time of writing and may not reflect current thinking.
Potential for Profit and Loss
All investment strategies have the potential for profit and loss, your or your clients’ capital may be at risk. Past performance is not a guide to future returns.
This communication contains information on investments which does not constitute independent research. Accordingly, it is not subject to the protections afforded to independent research, but is classified as advertising under Art 68 of the Financial Services Act (‘FinSA’) and Baillie Gifford and its staff may have dealt in the investments concerned.
All information is sourced from Baillie Gifford & Co and is current unless otherwise stated.
The images used in this communication are for illustrative purposes only.
199819 10064176