

Overview
ISIN
GB0007873697SEDOL
0787369Investment proposition
Share price and charges
Price
544.00pNAV at fair
587.17pNAV at book
563.59pPremium (+) or discount (-) at fair
-7.4%Premium (+) or discount (-) at book
-3.5%Ongoing charges*
0.59%Fund facts
Active share
86%**
Fund launch date
1873
AIC Investment Sector
Global Equity Income
Benchmark
FTSE All-World Index
**Relative to FTSE All-World Index. Source: Baillie Gifford & Co, FTSE.
An income that grows ahead of inflation is valuable. Better still if that income is resilient through thick and thin. SAINTS has delivered annual dividend increases for over fifty years and we are wholly focussed on doing so in the future.
Meet the managers

Meet the directors
Property managers

Intermediary client contacts
If you’d like further information, please get in touch with the Intermediary Client Contact for your area.
Ratings
As at: 31 May 2026
Morningstar Medalist Rating™

Dynamic Planner Risk Profile

Regulatory news announcements
Regulatory news announcements which are released to the London Stock Exchange can be accessed via their service.
The Association of Investment Companies
Further information on investment trusts and the investment trust sector can be found on The Association of Investment Companies website.
Risk Warnings
Risk Introduction
The investment trusts managed by Baillie Gifford & Co Limited are listed UK companies. The value of their shares, and any income from them, can fall as well as rise and investors may not get back the amount invested. The level of income is not guaranteed. The specific risks associated with the Trust include:
Currency
The Trust invests in overseas securities. Changes in the rates of exchange may also cause the value of your investment (and any income it may pay) to go down or up.
Emerging Markets
The Trust invests in emerging markets, which includes China, where difficulties with market volatility, political and economic instability including the risk of market shutdown, trading, liquidity, settlement, corporate governance, regulation, legislation and taxation could arise, resulting in a negative impact on the value of your investment.
Gearing
The Trust can borrow money to make further investments (sometimes known as "gearing" or "leverage"). The risk is that when this money is repaid by the Trust, the value of the investments may not be enough to cover the borrowing and interest costs, and the Trust will make a loss. If the Trust's investments fall in value, any invested borrowings will increase the amount of this loss.
Liquidity
Values for securities which are difficult to trade may not be readily available and there can be no assurance that any value assigned to such securities will accurately reflect the price the Trust might receive upon their sale.
Derivatives
The Trust can make use of derivatives which may impact on its performance.
Property
The Trust has some direct property investments, which may be difficult to sell. Valuations of property are only estimates based on the valuer's opinion. These estimates may not be achieved when the property is sold.
Corporate Bond
Corporate bonds are generally perceived to carry a greater possibility of capital loss than investment in, for example, higher rated UK government bonds. Bonds issued by companies and governments may be adversely affected by changes in interest rates and expectations of inflation.
Premium Risk
Share prices may either be below (at a discount) or above (at a premium) the net asset value (NAV). The Trust may issue new shares when the price is at a premium which may reduce the share price. Shares bought at a premium may have a greater risk of loss than those bought at a discount.
Buy-backs
The Trust can buy back its own shares. The risks from borrowing, referred to above, are increased when a trust buys back its own shares.
Regulation of Investment Trusts
The Trust is listed on the London Stock Exchange and is not authorised or regulated by the Financial Conduct Authority.
Index disclaimer
Fund performance
Periodic Performance
As at: 30 June 2026
1 Year | 3 Years | 5 Years | 10 Years | |
|---|---|---|---|---|
Share Price | 9.4% | 13.0% | 26.6% | 151.8% |
NAV | 7.1% | 19.1% | 35.2% | 180.1% |
Benchmark* | 28.1% | 66.3% | 79.1% | 250.5% |
Discrete Performance
As at: 30 June 2026
30/06/2021 – 30/06/2022 | 30/06/2022 – 30/06/2023 | 30/06/2023 – 30/06/2024 | 30/06/2024 – 30/06/2025 | 30/06/2025 – 30/06/2026 | |
|---|---|---|---|---|---|
Share Price | -3.0% | 15.6% | 1.1% | 2.2% | 9.4% |
NAV | 0.9% | 12.5% | 9.4% | 1.7% | 7.1% |
Benchmark* | -3.6% | 11.7% | 20.4% | 7.8% | 28.1% |
Performance
As at: 30 June 2026
Source: Morningstar, FTSE.
Performance figures appear in GBP. Benchmark data is limited to a 5 year period from the current date.
The graph has been rebased to 100.
Discount/premium history at fair
As at: 30 June 2026
Source: Morningstar. Premium/Discount of share price to NAV at fair.
If the graph shows negative figures this means that the share price is lower than the NAV at fair – this is known as trading at a Discount.
If the graph shows positive figures this means that the share price is higher than the NAV at fair - this is known as trading at a Premium.
Active Share
As at: 30 June 2026
Relative to FTSE All-World Index. Source: Baillie Gifford & Co, FTSE.
Dividend Growth Vs Inflation
As at: 31 December 2025
Figures rebased to 100 at 31 December 2014.
Source: LSEG/Baillie Gifford & Co. The Consumer Price Index (CPI) is a measure of inflation that is used in the Government's target for inflation.
Long-term dividend record
No dividend reductions in the past eighty years
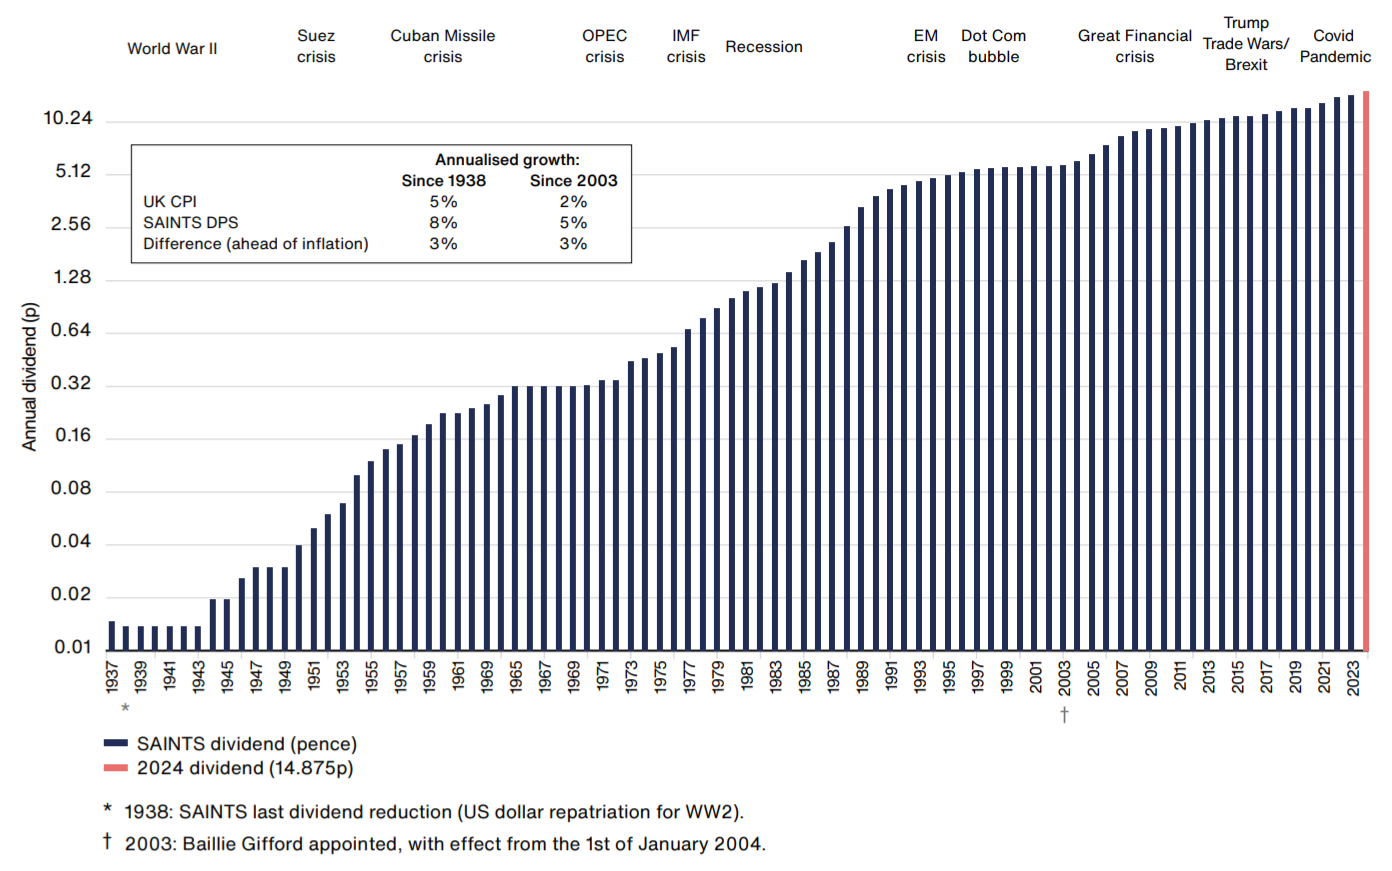
We have chosen to use a logarithmic scale for the dividend price to more clearly display the consistent level of dividend increase over the years.
Source: Scottish American Investment Trust Annual Reports, Baillie Gifford. Dividends are shown net of withholding taxes since 1973, when Advanced Corporation Tax was first introduced in the UK. Dividends from 1965-1973 are shown net of the 45% Corporation Tax introduced in the Finance Act of 1965. Dividends prior to 1965 are shown as if the Corporation Tax had existed before 1965, on a comparable basis.
Fund portfolio holdings
The list of top 10 holdings that this fund invests in.
As at: 30 June 2026
| # | Holding | % of total assets |
|---|---|---|
| 1 | TSMC | 4.7% |
| 2 | Apple | 3.5% |
| 3 | Atlas Copco | 2.8% |
| 4 | Coca-Cola | 2.7% |
| 5 | Alphabet | 2.7% |
| 6 | Procter & Gamble | 2.6% |
| 7 | Microsoft | 2.4% |
| 8 | Analog Devices | 2.4% |
| 9 | Roche | 2.3% |
| 10 | Watsco | 2.2% |
Property portfolio
More detail on the property portfolio of the Scottish American Investment Company can be found within the annual report.
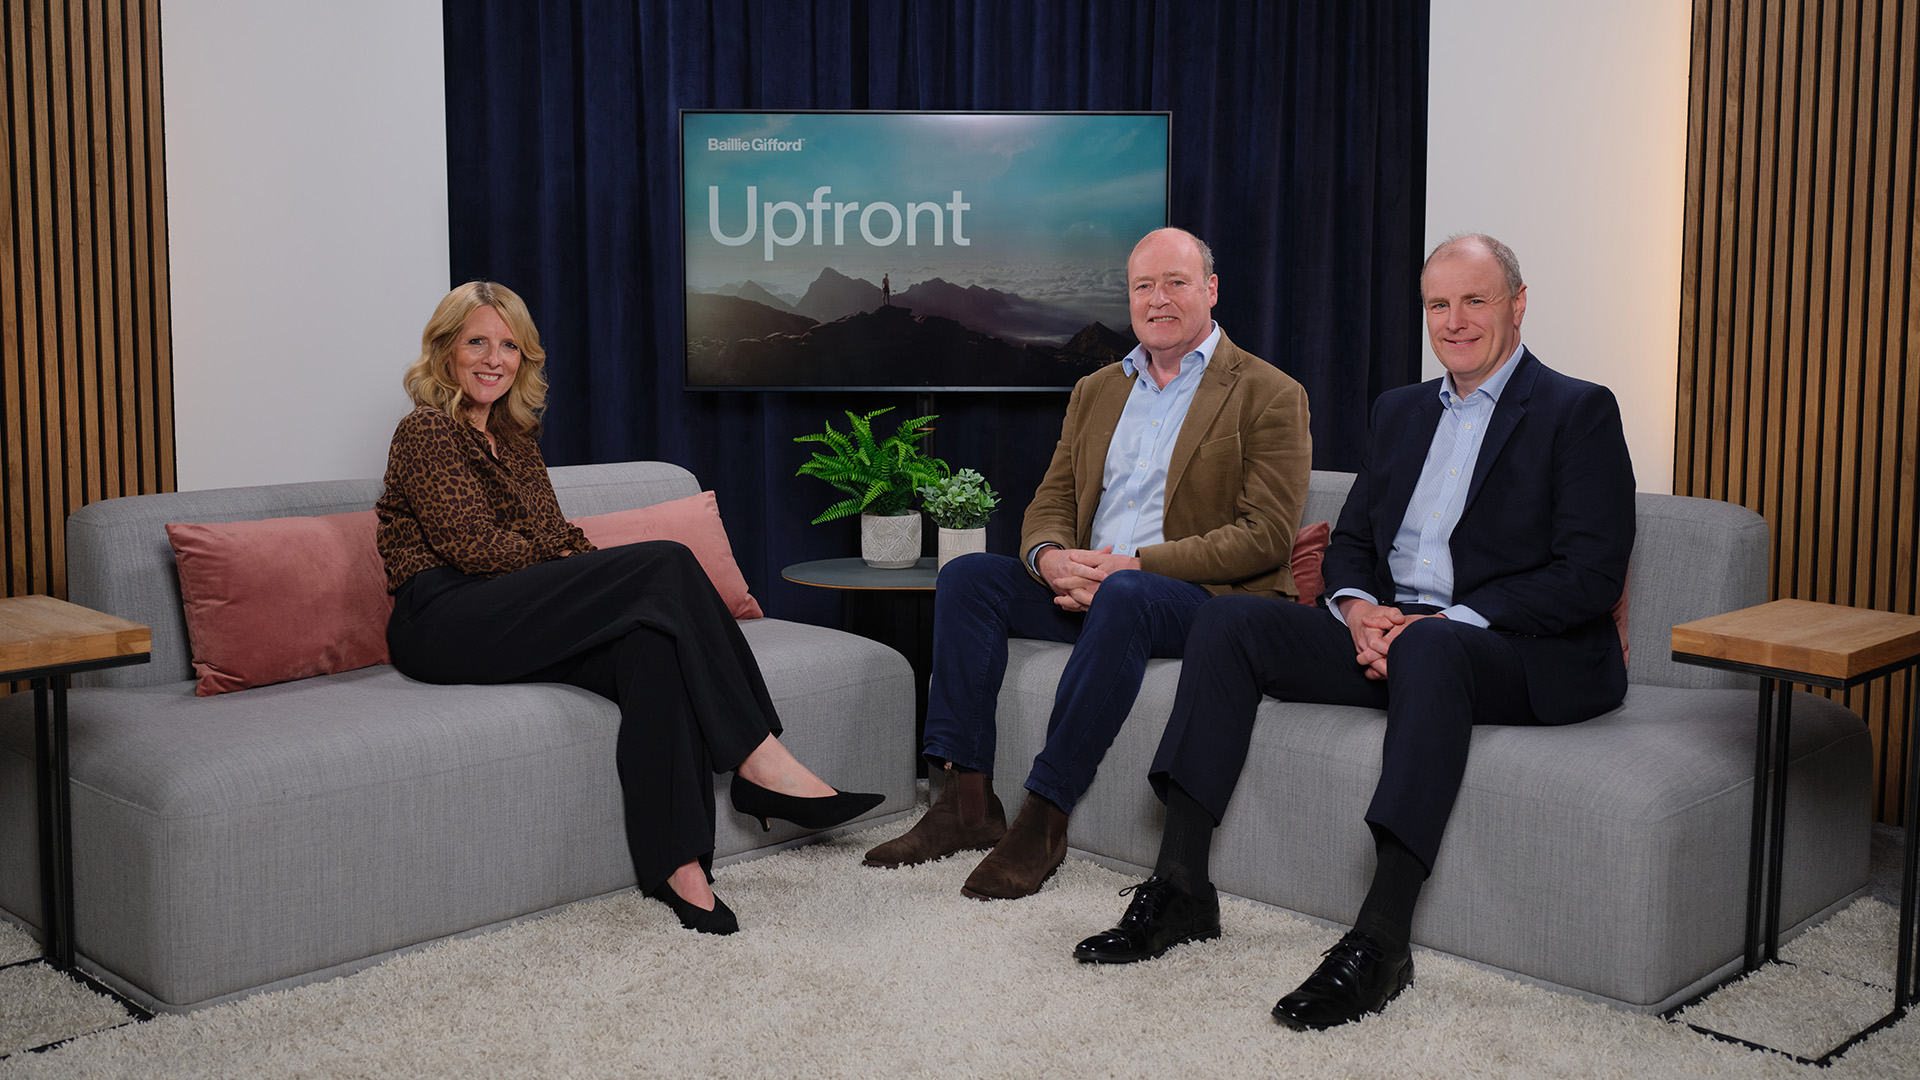
Insights
Key articles, videos and podcasts relating to the fund:
Filters
Insights
Mega-caps, ecommerce and SAINTS
We discuss concentrated markets, Sea Limited's digital ecosystem and SAINTS’ resilience.
Cash is king
Cash on balance sheets can offer resilience, optionality and room to invest for growth.
SAINTS spotlight: built for resilience
In a difficult quarter, it’s important to continue focusing on businesses built for the long term.
SAINTS: Manager Insights
James Dow shares SAINTS’ 2025 performance and future opportunities for the Trust.
Trip notes: Cleveland, Ohio
In rust-belt USA, paint and coatings companies are the unsung heroes of growth.
SAINTS spotlight: patience bears fruit
AI optimism and rate moves shaped stock markets in 2025, but owning quality businesses matters most long term.
SAINTS: fallen to earth?
Scottish American Investment Company manager James Dow discusses the trust's quality holdings and long-term growth drivers.
The science behind investing
From nanotechnology to investing, Olivia Knapp explores the chemistry of good research.
Profile of a returning industry veteran
After nearly 20 years leading global equity teams, explore why Alistair Way returns to Baillie Gifford.
SAINTS spotlight: a ‘wicked learning environment’
See how we’re finding real value in this challenging learning environment.
SAINTS spotlight: compounders weathering change
In a changing world, resilient compounders drive SAINTS’ long-term growth despite the market shifts and uncertainty.
Profile of a sustainability researcher
Explore how Ben Hart's sustainability research at Baillie Gifford integrates ESG into investment strategies.
SAINTS AGM: presentation to shareholders
James Dow updates shareholders on the resilience of the trust's dividend and portfolio.
SAINTS spotlight: the role of resilience
How SAINTS finds light amid tariff restrictions, with European exposure and a resilient portfolio.
SAINTS annual letter
James Dow reviews another year of inflation-beating dividend growth and explores new ideas for the portfolio.
Atlas Copco: Stock Story
Ben Drury explores how a culture of innovation and decentralisation drives success in industrial technology.
L'Oréal: Stock Story
Katie Muir discusses how innovation and a positive culture have fuelled the success of the world’s leading beauty enterprise.
SAINTS: adversity is opportunity
Finding diverse companies that share a great growth culture.
SAINTS: Manager Insights
James Dow shares SAINTS' 2024 performance and delves into the trust's dividend history.
Profile of an investigative researcher
Explore how Hatty Oliver's unique research at Baillie Gifford shapes investor thinking and informs income growth strategies.
SAINTS spotlight: steady amid euphoria
A focus on diversification and long-term compounders positions the portfolio for the future.
SAINTS: 50 years of dividend growth
How SAINTS has delivered consistent dividend growth for 50 years.
SAINTS spotlight: turbulence beneath the surface
Exploring SAINTS' strategic moves in the face of economic shifts and the pursuit of compounding growth.
SAINTS: Manager Insights
James Dow shares SAINTS' 2023 performance and 50-year dividend growth milestone.
A new recipe for weight loss
The huge growth potential of Novo Nordisk’s anti-obesity medicines.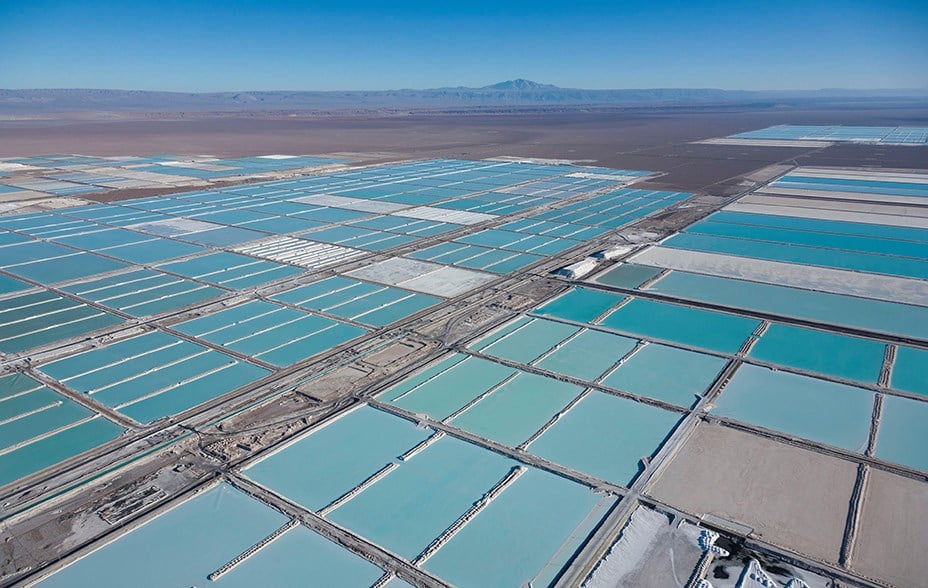
Albemarle: salt flats and social responsibility
Why the lithium giant Albemarle engages in research and data monitoring.
SAINTS: the case for dividend growth
Why we believe pursuing dividend growth rather than yield is the right way to grow capital.
SAINTS Stewardship Report 2023
Does engagement make a difference? The SAINTS Team provides its annual update.
The history of SAINTS
John Newlands reveals the roots of the SAINTS success story.
A century and a half of SAINTS
James Dow reflects on how the trust has changed over the decades, but stuck to its core values.
Webinar: the SAINTS approach
Co-manager James Dow explains why he believes in the Trust’s focus on sustainable compounding.
SAINTS Stewardship Report 2022
For the year ended March 2022.
Compound interest: the snowball effect
Companies reinvesting profits to supply outperformance over decades are the market’s unsung heroes.
Impact, Ambition and Trust
If ESG scores are not the answer, how does Global Income Growth Team’s ESG approach measure up?
SAINTS: A year in review and looking ahead.
The Scottish American Investment Company share an update on performance and ESG.
SAINTS Investment Trust Webinar.
SAINTS co-manager James Dow reviews 2021 and looks ahead to the exciting opportunities he sees for long-term income and growth.
Scottish American Investment Company P.L.C. Stewardship Report.
For the year ended March 2021.
Scottish American Investment Company - Manager Insights.
Investment Manager Toby Ross gives an update on The Scottish American Investment Company P.L.C.
Income And Growth For The Next 10 Years.
In this webinar recording, client director Seb Petit talks to James Dow, co-manager of The Scottish American Investment Company (SAINTS). Dow outlines how a long-term approach and a growth mindset helped investors in SAINTS navigate the great dividend crisis of 2020.
Navigating the Great Dividend Crisis.
Co-head of the Baillie Gifford Equity Income Team James Dow delivers a webinar giving insight into his thoughts on how investors can navigate the current global dividend crisis.
Tomorrow’s income aristocrats
Income investing has been shaken by the coronavirus, but how will this affect the dividend payers of the future? Baillie Gifford investment manager James Dow gives us a glimpse of the potential star performers of tomorrow.
SAINTS annual update
Investment manager James Dow gives un update on the The Scottish American Investment Company P.L.C.
Watsco - a cool investment
Investment manager Toby Ross discusses recent investment, Watsco.
Should income investors go global
What are “the good, the bad and the unbelievably great” of global investing? In the second episode of Short Briefings on Long Term Thinking, Malcolm Borthwick is joined by James Dow to challenge the conventional wisdom that if you’re investing for a regular income you should stick with blue chip UK companies.
SAINTS - Seeking an income that stays on track for years to come
Join Toby Ross and James Dow, SAINTS’ joint managers, on their travels as they seek out the companies from across the globe that they believe can deliver a dependable and growing income along with capital growth.
Mega-caps, ecommerce and SAINTS
We discuss concentrated markets, Sea Limited's digital ecosystem and SAINTS’ resilience.Cash is king
Cash on balance sheets can offer resilience, optionality and room to invest for growth.SAINTS spotlight: built for resilience
In a difficult quarter, it’s important to continue focusing on businesses built for the long term.SAINTS: Manager Insights
James Dow shares SAINTS’ 2025 performance and future opportunities for the Trust.Trip notes: Cleveland, Ohio
In rust-belt USA, paint and coatings companies are the unsung heroes of growth.SAINTS spotlight: patience bears fruit
AI optimism and rate moves shaped stock markets in 2025, but owning quality businesses matters most long term.SAINTS: fallen to earth?
Scottish American Investment Company manager James Dow discusses the trust's quality holdings and long-term growth drivers.The science behind investing
From nanotechnology to investing, Olivia Knapp explores the chemistry of good research.Profile of a returning industry veteran
After nearly 20 years leading global equity teams, explore why Alistair Way returns to Baillie Gifford.SAINTS spotlight: a ‘wicked learning environment’
See how we’re finding real value in this challenging learning environment.SAINTS spotlight: compounders weathering change
In a changing world, resilient compounders drive SAINTS’ long-term growth despite the market shifts and uncertainty.Profile of a sustainability researcher
Explore how Ben Hart's sustainability research at Baillie Gifford integrates ESG into investment strategies.SAINTS AGM: presentation to shareholders
James Dow updates shareholders on the resilience of the trust's dividend and portfolio.SAINTS spotlight: the role of resilience
How SAINTS finds light amid tariff restrictions, with European exposure and a resilient portfolio.SAINTS annual letter
James Dow reviews another year of inflation-beating dividend growth and explores new ideas for the portfolio.Atlas Copco: Stock Story
Ben Drury explores how a culture of innovation and decentralisation drives success in industrial technology.L'Oréal: Stock Story
Katie Muir discusses how innovation and a positive culture have fuelled the success of the world’s leading beauty enterprise.SAINTS: adversity is opportunity
Finding diverse companies that share a great growth culture.SAINTS: Manager Insights
James Dow shares SAINTS' 2024 performance and delves into the trust's dividend history.Profile of an investigative researcher
Explore how Hatty Oliver's unique research at Baillie Gifford shapes investor thinking and informs income growth strategies.SAINTS spotlight: steady amid euphoria
A focus on diversification and long-term compounders positions the portfolio for the future.SAINTS: 50 years of dividend growth
How SAINTS has delivered consistent dividend growth for 50 years.SAINTS spotlight: turbulence beneath the surface
Exploring SAINTS' strategic moves in the face of economic shifts and the pursuit of compounding growth.SAINTS: Manager Insights
James Dow shares SAINTS' 2023 performance and 50-year dividend growth milestone.A new recipe for weight loss
The huge growth potential of Novo Nordisk’s anti-obesity medicines.Albemarle: salt flats and social responsibility
Why the lithium giant Albemarle engages in research and data monitoring.SAINTS: the case for dividend growth
Why we believe pursuing dividend growth rather than yield is the right way to grow capital.SAINTS Stewardship Report 2023
Does engagement make a difference? The SAINTS Team provides its annual update.The history of SAINTS
John Newlands reveals the roots of the SAINTS success story.A century and a half of SAINTS
James Dow reflects on how the trust has changed over the decades, but stuck to its core values.Webinar: the SAINTS approach
Co-manager James Dow explains why he believes in the Trust’s focus on sustainable compounding.SAINTS Stewardship Report 2022
For the year ended March 2022.Compound interest: the snowball effect
Companies reinvesting profits to supply outperformance over decades are the market’s unsung heroes.Impact, Ambition and Trust
If ESG scores are not the answer, how does Global Income Growth Team’s ESG approach measure up?SAINTS: A year in review and looking ahead.
The Scottish American Investment Company share an update on performance and ESG.SAINTS Investment Trust Webinar.
SAINTS co-manager James Dow reviews 2021 and looks ahead to the exciting opportunities he sees for long-term income and growth.Scottish American Investment Company P.L.C. Stewardship Report.
For the year ended March 2021.Scottish American Investment Company - Manager Insights.
Investment Manager Toby Ross gives an update on The Scottish American Investment Company P.L.C.Income And Growth For The Next 10 Years.
In this webinar recording, client director Seb Petit talks to James Dow, co-manager of The Scottish American Investment Company (SAINTS). Dow outlines how a long-term approach and a growth mindset helped investors in SAINTS navigate the great dividend crisis of 2020.Navigating the Great Dividend Crisis.
Co-head of the Baillie Gifford Equity Income Team James Dow delivers a webinar giving insight into his thoughts on how investors can navigate the current global dividend crisis.Tomorrow’s income aristocrats
Income investing has been shaken by the coronavirus, but how will this affect the dividend payers of the future? Baillie Gifford investment manager James Dow gives us a glimpse of the potential star performers of tomorrow.SAINTS annual update
Investment manager James Dow gives un update on the The Scottish American Investment Company P.L.C.Watsco - a cool investment
Investment manager Toby Ross discusses recent investment, Watsco.Should income investors go global
What are “the good, the bad and the unbelievably great” of global investing? In the second episode of Short Briefings on Long Term Thinking, Malcolm Borthwick is joined by James Dow to challenge the conventional wisdom that if you’re investing for a regular income you should stick with blue chip UK companies.SAINTS - Seeking an income that stays on track for years to come
Join Toby Ross and James Dow, SAINTS’ joint managers, on their travels as they seek out the companies from across the globe that they believe can deliver a dependable and growing income along with capital growth.
AGM and voting
When you invest in an investment trust you become a shareholder and have a say on how the Company is run. You also have a right to attend the Company's annual general meeting (AGM).
How to vote
The following link will take you through to The Association of Investment Trusts' (AIC) website where there is information on how to vote your shares if you hold them via one of the major platforms.
How to attend the AGM
If you hold your shares through a platform, it is not always obvious how to attend an AGM. The following link will take you through to The Association of Investment Trusts’ (AIC) website where there is information on how your platform can help you attend this important shareholder meeting. If you do not see your provider listed, please contact your provider directly and ask them to assist.
SAINTS corporate calendar
Our corporate calendar provides details of the regulatory events that occur over the year. This includes dates for reports, results, dividend payments and the AGM.
| Event | Month (each year) |
| Final results announced | February |
| Interim results announced | August |
| Financial year end date | 31 December |
| Annual general meeting | April |
| Dividends payable | April, June, September, December |
AGM
SAINTS annual general meeting (AGM) was held on Tuesday 8 April 2025. You can read a summary of the results of the voting on AGM resolutions here.
Voting
A breakdown of the votes cast by Baillie Gifford over the previous quarter on behalf of the investment trust is available in the Proxy voting disclosure.
Registrar
Computershare Investor Services PLC maintains the share register on behalf of the Company. Queries regarding shares registered in your own name can be directed to:
Computershare Investor Service PLC,
The Pavilions,
Bridgwater Road,
Bristol,
BS99 6ZZ
T: +44 (0)370 707 1282
Documents
You can access any literature about the Fund here.
To download any document you will need Adobe Reader. Please note that we can now provide you with Braille and audio transcriptions of our literature on request. It may take up to 10 days for the transcription to be completed dependent on the size of the document.