Key points
- Market commentators fear current valuations, but patient investors see abundant opportunities
- The portfolio currently presents decade-low valuation premiums with decade-high exceptional growth exposure
- Fundamental growth drives long-term outperformance - LTGG is about fundamentals, not fairytales
As with any investment, your capital is at risk.

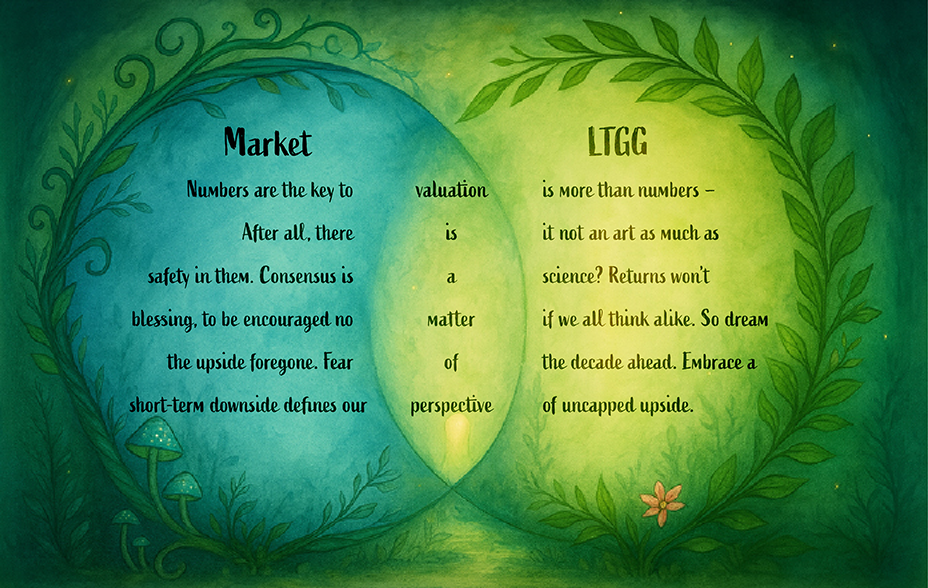
All images are generated by AI
Blabberstocky
Lewis Carroll’s poem Jabberwocky, which Alice discovers in the children’s book Through the Looking Glass in 1871, is a masterpiece of nonsense. Despite the words being entirely made up, the poem conveys fear and suspense.
Now imagine if the looking glass had transported Alice over 150 years into the future to the busy trading floor of the New York Stock Exchange in mid-2025. The poem she discovers might instead start as follows:
’Twas brillig, the frothiness risk
Shiller-caped and trailed in p/e.
All jittered were the beta-sick,
Candle-sticked, upside unseen.
After reading, Alice would likely make the same honest remark she made after reading the original Jabberwocky: "Somehow it seems to fill my head with ideas – only I don’t know exactly what they are!"
We sympathise. On the rare occasions when we take a curious glimpse at financial market commentaries, we remind ourselves to ‘Beware the Blabberstock!’
At the time of writing, for instance, market doomsayers are pointing to ominous rumblings from the Shiller CAPE (cyclically adjusted price-to-earnings) ratio, which is more than double its long-term average in the US market. Others, meanwhile, lament the clarion call of the S&P 500’s trailing price-to-earnings (P/E) ratio, which we’re told is over one-and-a-half standard deviations above its historic norm.
Elsewhere, there is constant hubbub about Fibonacci extensions, monthly reversal candles, coiling patterns, and all sorts of other technical terms that sound simultaneously intelligent and unintelligible. If Lewis Carroll were among us today, he might have found little desire to write Jabberwocky, since the financial industry already excels at nonsense words for fuelling fear and suspense.
Such agitations are in stark contrast to what Alice would presently see in the Long Term Global Growth (LTGG) portfolio. The degree of growth across LTGG holdings typically means that the portfolio commands a higher valuation premium compared to the broader market, but Alice would observe that this premium is currently around the lowest it’s been in a decade.
Meanwhile, the extent of exceptional growth in the portfolio is around the highest it’s been in a decade. “Curiouser and curiouser!” More on this later.
Alice’s observations provide grounds for even more LTGG optimism than usual at the current juncture. But over the past 21 years, since the founding of the LTGG strategy, we have remained optimists even when the portfolio’s valuation premium and/or growth premium have at times appeared optically less attractive than today.
This is because we always look beyond isolated spot numbers, such as P/E ratios. Without directional context, situational awareness, and bottom-up fundamental analysis, they are meaningless. Price is very different to value.
But our disdain for uncontextualised metrics should not be confused with a lack of discipline in our assessment of company valuations. Similarly, our focus on optimism and upside scenarios should not create the impression that our approach to valuation analysis is naïve.
We acknowledge that our valuation approach is unusual. Purposefully so. We suspect that a conventional approach to valuation would lead to conventional returns. That may suffice for some investment managers, but not us. Had we bowed to such convention, we likely would not have outperformed by approximately 4 per cent per annum over the last 21 years, net of fees.
So what is this unconventional approach to valuation?
Once upon a time…
The LTGG strategy, launched in 2004, was born into the financial markets equivalent of a nuclear fallout. The preceding few years had witnessed the meteoric rise and precipitous fall of countless companies riding the tailwind of the early Internet.
For context, not even the Global Financial Crisis of 2008-09, the Covid-19 crash of 2020, or the post-pandemic crash of 2022-23 would come anywhere near the severity and duration of the drawdown experienced during the Dotcom bubble at the turn of the 21st century.
Dotcom companies might have intrigued Alice, for they were mostly the stuff of fairytales. Many had no revenues, let alone earnings. At a time when investors prized eyeballs over earnings, the absence of business fundamentals did little to dissuade an exuberant stock market. When mass euphoria eventually turned to panic, many companies failed as fast as they had boomed.
One might imagine that the post-Dotcom years should have heralded a time of reflection in the financial industry on the matter of valuation discipline. After all, there was an opportunity to take a more holistic approach to valuing companies, including, for instance, the sustainability of returns, adaptability, capital allocation, alignment with the interests of long-term shareholders, and so forth. Instead, the market doubled down on spot multiples, tracking errors, information ratios, and other traditional metrics.
For the nascent LTGG strategy, we chose a different path. We suspected that more fiction was being written in Excel than in Word. While we wouldn’t be lured into blindly believing in Dotcom-like fairytales, we wouldn’t unquestioningly adopt conventional financial analysis either.
For example, we purposefully avoided leaning into theories from the 1960s, such as the capital asset pricing model (CAPM) – a widely used formula for calculating risk versus return – which continues to dominate financial markets training today.
There is no evidence that ‘beta’ – a proxy for a stock’s relative volatility, which sits at the core of the CAPM – explains the performance of individual stocks over the long term. The output of the CAPM is therefore more fiction than prediction, a fairytale in its own right. Nonetheless, financial analysts continue to embrace the CAPM and – worse – copy each other’s assumptions.
Now contrast that with this:
- "The dominance of the apparatus of beta and tracking errors is the inevitable punishment for intellectual feebleness in refusing to fight the tentacles of efficient market theory and the notion of scientific investment management.”
- "If we have no insight unshared by the market about the quantity or quality of earnings, we should ignore a stock. If momentum and money flows make us underperform for a quarter, we don’t apologise or re-think.”
These are extracts from an internal Baillie Gifford paper written in 2003 while the world was still reeling from the mess of valuation analysis that culminated in the Dotcom crash. That paper was the genesis for the LTGG strategy. The paper’s differentiated approach to valuation manifested itself in the creation of our 10 Question Stock Research Framework (the ‘10Q’), which we continue to use consistently to this day.

Valuation touches every question in our 10Q. In assessing the probabilities of future cash flows, we need to consider top-line growth, margins, the durability of competitive advantage, management culture, and capital allocation.
For instance, if revenues rise manyfold, this provides a more likely basis for future cashflows to significantly increase, but the market’s fixation on the next quarter often forgets about this obvious outcome of compound growth.
Consider luxury brand Hermès, which was not an obvious buy for LTGG in 2004. The company was already a luxury powerhouse, its family ownership was already over a century old, the brand was already global, and the stock was already sitting on a near-term P/E ratio that most sell-side brokers considered to be eye-wateringly expensive.
But Hermès went on to prove its ability to generate unusually elevated returns on assets year after year, decade after decade, resulting in steadily compounding returns for the patient investor. Standard financial models that assume an inevitable near-term growth fade simply don’t apply here. Hermès has delivered a circa 50x return during our holding period. It’s a powerful reminder that, for LTGG, one of our greatest luxuries is time.
Beyond the numbers
Turning back to the 10Q, our focus on margins and returns leads us to unearth companies that not only grow over the long term, but also become much more profitable as they achieve scale. The drivers of such growth and profitability are to be found in inherently unquantifiable characteristics, such as company culture and visionary management, investment timeframes, and a willingness to experiment and adapt.
For the sorts of outlier growth companies we seek to invest in, these intangible aspects often move the dial on success far more than for the average company.
Consider Chinese battery maker CATL, for instance. Our recent visit to the company’s headquarters and automated smart factory in Ningde, China, highlighted the ever-expanding and diversifying volume growth opportunity – from electric vehicles to energy storage systems, robotics, electric aircraft, and more.
Having continually reinvested heavily in research and development, CATL now commands a near-40 per cent market share globally and industry-leading production processes. Throughput at its smart factory is a third higher than the industry average, reducing manufacturing unit cost by a third.
There are clear signals here of long-term vision, adaptability, experimentation, and increasing returns to scale. Yet the market is fixated on the stock’s modest short-term P/E premium to the average Chinese market multiple.
This says nothing of the inferiority of CATL’s competition, towards which the market believes it will derate. Given the longevity and quality of the opportunity, there is good cause for conviction in the opposite.
The first eight questions of our 10Q provide us with insights into the business fundamentals, both quantitative and qualitative. We then arrive at answers to questions 9 and 10: how the company might grow to many multiples of its current worth (or even quintuple), and why the market might not realise this.
Our response to Question 9 is never singular and never definitive. This is because the range of possibilities for the outlier companies we invest in is typically large, and the outcomes are uncertain and potentially extreme. We should expect nothing less in LTGG.
Accepting the fact that no model can spit out a simple answer to satisfy us, we must stretch our minds to entertain several scenarios, from the ordinary to the outlandish. If we were to constrain our thinking to the ‘average’ scenario, then we should expect only average returns.
Instead, we spend a disproportionate amount of time investigating the extreme upside – essential for capturing disproportionate returns. This might make us look very silly at times. But for a strategy such as LTGG, it would be far sillier of us to miss out on such extreme payoffs.
The probability of extreme outcomes
The final piece of the puzzle is asking ourselves what likelihoods we would attach to our scenarios for our holdings. Knowing that only a tiny percentage of companies in our investment universe can be expected to quintuple over a five-year period, we seek to gain sufficient conviction that the likelihood of our upside thesis for a company is higher than that base rate.
Probability-adjusted payoffs, therefore, explain the portfolio’s position sizing. This is why, for instance, Joby Aviation – the maker of electric vertical take-off and landing aircraft (ie flying taxis) – is presently a small circa 1 per cent holding.
Its range of potential outcomes is vast: perhaps it will fail to get full commercial certification, perhaps it will run out of capital, or perhaps it will revolutionise the skies much like Tesla revolutionised the roads by heralding an era of electrified aviation. As extreme as that latter scenario might be, for the time being we can only ascribe a small probability of it coming to pass.
In contrast, a larger holding size – such as Amazon or Tencent – may reflect a narrower range of potential outcomes and a higher-conviction upside case of 2-3x from here.
None of this is easy. Our edge lies in our embrace of the unknown, rather than reaching for ready-made financial models or the supposed safety of the herd. By necessity, our valuation discipline is as much of an art as a science.
Be assured that we still do our number-crunching, but frankly, that’s usually the simple bit. The bread and butter of a well-trained investment analyst. The fact is, company accounts and numbers alone cannot tell the full story. The hard bit is marrying such quantitative analysis with the many unique characteristics and qualitative aspects of the exceptional businesses that pique our interest.
The emperor’s new clothes or golden eggs?
The perennial challenge of valuation analysis is whether a company’s future value is already priced in or whether this is, in fact, a company that will defy sceptics by delivering outsized returns that compound over time. The degree of divergence between these perspectives (ie questions 9 and 10 of our framework) provides us with our opportunity.
Imagine, for example, if we had fallen into the trap of valuing Amazon based on its triple-digit P/E ratio in 2005 at a market capitalisation of around $20bn, a year after our initial purchase.
That was the same year Amazon introduced free shipping with its Prime subscription model, leading many financial analysts to suspect it would lock in profitless growth forevermore. As a result, its share price dropped by more than 35 per cent.
We exercised patience, convinced by the fundamentals that we had unearthed in our 10 Question Stock Research Framework: eg a visionary founder, unwavering focus on the long term, relentless focus on the customer, and a business model ideally positioned to benefit from deep multi-decade transformations in computing and consumer spending habits.
Amazon subsequently grew its profits over the next 20 years at a compound annual growth rate north of 40 per cent per year. At the time of writing, Amazon’s market capitalisation is over $2.3tn and it has delivered an LTGG holding period return in excess of 100x in absolute terms.
Imagine if we had sold Netflix after it had posted two bad quarterly earnings releases in 2022, following the explosive demand it had witnessed during the pandemic. The disappointing results occurred precisely at a time when stock markets were in peak distress and streaming competition was more intense than ever. The market grew fearful of a valuation fairytale, and thus Netflix’s share price plummeted by 75 per cent.
In contrast, we reviewed our thesis and decided to exercise patience, encouraged by the steps taken by the company to tackle account-sharing and introduce advertising. The company delivered.
Subscriber numbers restarted their growth trajectory, advertising demonstrated strong early progress, and unprofitable streaming peers realised they couldn’t compete against Netflix’s sheer scale in a more challenging market environment.
The company’s share price subsequently grew approximately sevenfold in the next three years, reaching roughly double the value of its pandemic-era peak.
Separating hype from hypergrowth
By the same logic as the examples above, should we sell NVIDIA? Is it still a golden egg or a Dotcom-like fairytale? Initially purchased for the LTGG portfolio in 2016, it has since delivered an over 100x return in absolute share price terms.
We have, moreover, recycled about 10 per cent out of the portfolio from NVIDIA alone over the past three years, using the proceeds to plant seeds for future growth – as we’ve always done. But at a market capitalisation in excess of $4tn at the time of writing, many financial analysts would have us believe that the AI-fuelled market froth will inevitably fizzle and NVIDIA’s future growth will fade – or worse, turn into a Dotcom-era Cisco.
They may be right. But if they’re wrong — ie, if NVIDIA still has ample growth runway ahead of it that the market is failing to appreciate — then the payoff is likely to be leviathan in scale. Let’s recall that NVIDIA’s market valuation is grounded in its fundamentals.
At the time of writing, its P/E ratio is trading at around a 10 per cent premium to its 10-year average – hardly unreasonable for the leading hardware and software business underpinning the global AI revolution. So what explains NVIDIA’s valuation?
Extraordinary fundamentals. NVIDIA’s earnings per share have more than doubled every year over the past three years, meaning it has largely kept pace with share price appreciation.
How should we think about NVIDIA’s upside from here? Based on today’s valuation, the market appears to expect NVIDIA will generate $300bn in revenues in 2030. This projection assumes a doubling of current revenues, translating to a 15 per cent annual growth rate over the next five years. Is this too tame?
NVIDIA has been growing its revenues at over 70 per cent per year on average during the past three years, and there is currently no evidence that its large hyperscaler customers are curtailing their spending.
Our recent conversations with the CEOs of several NVIDIA customers, including the likes of Mark Zuckerberg at Meta and Sam Altman at OpenAI, suggest this is an existential matter: it’s better to spend now and be ready with the infrastructure early than be too slow and miss out on the most important technological development of the next 20 years.
If the large numbers appear too mindboggling, it’s worth recalling that capital expenditure on AI datacentres today accounts for just over 1 per cent of US GDP. That’s far short of the 6 per cent spent on railroads in the 1880s… for now.
So, let’s imagine demand continues for datacentre capex over the next five years. And imagine that additional applications of AI – notably embodied intelligence (EI) in the form of robotics and autonomous driving – develop into significant new amplifiers of demand.
Even if we assume a slowdown in revenue growth from around 70 per cent to closer to 25-30 per cent per year, that would translate into around $500 to 600bn in revenues by 2030 (a big number, but still considerably less than Walmart’s revenues today).
While NVIDIA’s net profit margin has roughly tripled since our initial purchase in 2016 (reaching around 55 to 60 per cent), let’s assume it remains stable from here as NVIDIA shares more incremental margin with its customers to further deepen its competitive advantage.
Let’s also assume some derating in NVIDIA’s P/E ratio. Together, this paints a scenario whereby NVIDIA doubles in value from here by 2030, maybe more. That may warrant our patience.
High growth, modest premiums
There are many examples in the LTGG portfolio similar to the cases cited above, whereby companies attract optically high valuations, prompting market anxiety, but where solid fundamentals in fact support those valuations.
It bears recalling that the LTGG portfolio’s exposure to the top quintile of forecast growth in earnings-per-share is around the highest it’s been in the past decade – close to 70 per cent of the portfolio by weight at the time of writing.
Meanwhile, valuation premiums – measured in terms of forward price to earnings or sales ratios – are at the narrowest they have been in a decade. And while the valuation and/or growth premiums have varied throughout the 21-year history of the LTGG strategy, and will likely continue to do so, operational performance (measured as revenue growth) has been the greatest contributor by far to the portfolio’s long-term outperformance – not multiple expansion. LTGG is therefore a story of fundamentals, not fairytales.
Inevitably, at times, there are exceptions. With support from our Investment Risk, Research and Analytics Team, we continue to monitor cases where share price performance is driven more by multiple expansion than by operational growth.
At a portfolio level, this helps us to gain greater situational awareness. At a stock level, this often prompts discussion and potentially further analysis. One such recent example is Spotify.
Through our research and recent discussions with founder CEO Daniel Ek, we continue to believe that growth in subscriptions and advertising, fuelled by AI-enhanced products and efficiencies, is poised to deliver significant upside from here. However, we recently reduced our holding because we believe the market’s view has grown closer to ours.
Happily ever after?
From the bustling NYSE trading floor, Alice tumbles back through the looking glass. This time, she is catapulted through over two decades of LTGG history.
She witnesses a global financial crisis, a China slowdown, a global pandemic, and many more macroeconomic shocks. She bats away countless news headlines and market metrics flashing red. Alarm bells sound constantly, most of which turn out to be false.
From the gloom, a pair of eyes emerges. And a wide, toothy smile. The Cheshire Cat.
“Be curious, be wild, be wonderfully weird!” it says.
Alice’s attention turns away from the noise buzzing around her. In the background and almost imperceptible, multi-decade shifts unfold, sometimes quickly and sometimes slowly.
At their helm, a small set of companies – the outliers – present exceptional qualities and wondrous opportunities. There are ups and downs, of course, sometimes extreme, but over the long term, they blossom and thrive.
And with that, the Cheshire Cat disappears again, leaving Alice with one final poem…
Annual past performance to 30 September each year (%)
| 2021 | 2022 | 2023 | 2024 | 2025 | |
| Long Term Global Growth Composite (gross) | 26.8 | -48.4 | 20.7 | 40.0 | 32.1 |
| Long Term Global Growth Composite (net) | 25.9 | -48.8 | 19.9 | 39.1 | 31.2 |
| MSCI ACWI Index | 28.0 | -20.3 | 21.4 | 32.3 | 17.8 |
Annualised returns to 30 September 2025 (%)
| 1 year | 5 years | 10 years | |
| Long Term Global Growth Composite (gross) | 32.1 | 7.9 | 19.0 |
| Long Term Global Growth Composite (net) | 31.2 | 7.1 | 18.2 |
| MSCI ACWI Index | 17.8 | 14.1 | 12.5 |
Source: Revolution, MSCI. USD. Returns have been calculated by reducing the gross return by the highest annual management fee for the composite. LTGG composite is more concentrated than MSCI ACWI Index.
Past performance is not a guide to future returns.
Legal notice: MSCI makes no express or implied warranties or representations and shall have no liability whatsoever with respect to any MSCI data contained herein. The MSCI data may not be further redistributed or used as a basis for other indexes or any securities or financial products. This report is not approved, endorsed, reviewed or produced by MSCI. None of the MSCI data is intended to constitute investment advice or a recommendation to make (or refrain from making) any kind of investment decision and may not be relied on as such.
Risk factors and important information
The views expressed should not be considered as advice or a recommendation to buy, sell or hold a particular investment. They reflect opinion and should not be taken as statements of fact nor should any reliance be placed on them when making investment decisions.
This communication was produced and approved in October 2025 and has not been updated subsequently. It represents views held at the time of writing and may not reflect current thinking.
Potential for Profit and Loss
All investment strategies have the potential for profit and loss, your or your clients’ capital may be at risk. Past performance is not a guide to future returns.
This communication contains information on investments which does not constitute independent research. Accordingly, it is not subject to the protections afforded to independent research, but is classified as advertising under Art 68 of the Financial Services Act (‘FinSA’) and Baillie Gifford and its staff may have dealt in the investments concerned.
All information is sourced from Baillie Gifford & Co and is current unless otherwise stated.
The images used in this communication are for illustrative purposes only.
Important Information
Baillie Gifford & Co and Baillie Gifford & Co Limited are authorised and regulated by the Financial Conduct Authority (FCA). Baillie Gifford & Co Limited is an Authorised Corporate Director of OEICs.
Baillie Gifford Overseas Limited provides investment management and advisory services to non-UK Professional/Institutional clients only. Baillie Gifford Overseas Limited is wholly owned by Baillie Gifford & Co. Baillie Gifford & Co and Baillie Gifford Overseas Limited are authorised and regulated by the FCA in the UK.
Persons resident or domiciled outside the UK should consult with their professional advisers as to whether they require any governmental or other consents in order to enable them to invest, and with their tax advisers for advice relevant to their own particular circumstances.
Financial Intermediaries
This communication is suitable for use of financial intermediaries. Financial intermediaries are solely responsible for any further distribution and Baillie Gifford takes no responsibility for the reliance on this document by any other person who did not receive this document directly from Baillie Gifford.
Europe
Baillie Gifford Investment Management (Europe) Ltd (BGE) is authorised by the Central Bank of Ireland as an AIFM under the AIFM Regulations and as a UCITS management company under the UCITS Regulation. BGE also has regulatory permissions to perform Individual Portfolio Management activities. BGE provides investment management and advisory services to European (excluding UK) segregated clients. BGE has been appointed as UCITS management company to the following UCITS umbrella company; Baillie Gifford Worldwide Funds plc. BGE is a wholly owned subsidiary of Baillie Gifford Overseas Limited, which is wholly owned by Baillie Gifford & Co. Baillie Gifford Overseas Limited and Baillie Gifford & Co are authorised and regulated in the UK by the Financial Conduct Authority.
Hong Kong
Baillie Gifford Asia (Hong Kong) Limited 柏基亞洲(香港)有限公司 is wholly owned by Baillie Gifford Overseas Limited and holds a Type 1 license from the Securities & Futures Commission of Hong Kong to market and distribute Baillie Gifford’s range of collective investment schemes to professional investors in Hong Kong. Baillie Gifford Asia (Hong Kong) Limited 柏基亞洲(香港)有限公司 can be contacted at Suites 2713-2715, Two International Finance Centre, 8 Finance Street, Central, Hong Kong. Telephone +852 3756 5700.
South Korea
Baillie Gifford Overseas Limited is licensed with the Financial Services Commission in South Korea as a cross border Discretionary Investment Manager and Non-discretionary Investment Adviser.
Japan
Mitsubishi UFJ Baillie Gifford Asset Management Limited (‘MUBGAM’) is a joint venture company between Mitsubishi UFJ Trust & Banking Corporation and Baillie Gifford Overseas Limited. MUBGAM is authorised and regulated by the Financial Conduct Authority.
Australia
Baillie Gifford Overseas Limited (ARBN 118 567 178) is registered as a foreign company under the Corporations Act 2001 (Cth) and holds Foreign Australian Financial Services Licence No 528911. This material is provided to you on the basis that you are a “wholesale client” within the meaning of
section 761G of the Corporations Act 2001 (Cth) (“Corporations Act”). Please advise Baillie Gifford Overseas Limited immediately if you are not a wholesale client. In no circumstances may this material be made available to a “retail client” within the meaning of section 761G of the Corporations Act.
This material contains general information only. It does not take into account any person’s objectives, financial situation or needs.
South Africa
Baillie Gifford Overseas Limited is registered as a Foreign Financial Services Provider with the Financial Sector Conduct Authority in South Africa.
North America
Baillie Gifford International LLC is wholly owned by Baillie Gifford Overseas Limited; it was formed in Delaware in 2005 and is registered with the SEC. It is the legal entity through which Baillie Gifford Overseas Limited provides client service and marketing functions in North America. Baillie Gifford Overseas Limited is registered with the SEC in the United States of America.
The Manager is not resident in Canada, its head office and principal place of business is in Edinburgh, Scotland. Baillie Gifford Overseas Limited is regulated in Canada as a portfolio manager and exempt market dealer with the Ontario Securities Commission ('OSC'). Its portfolio manager licence is currently passported into Alberta, Quebec, Saskatchewan, Manitoba and Newfoundland & Labrador whereas the exempt market dealer licence is passported across all Canadian provinces and territories.
Israel
Baillie Gifford Overseas Limited is not licensed under Israel’s Regulation of Investment Advising, Investment Marketing and Portfolio Management Law, 5755-1995 (the Advice Law) and does not carry insurance pursuant to the Advice Law. This material is only intended for those categories of Israeli residents who are qualified clients listed on the First Addendum to the Advice Law.
Singapore
Baillie Gifford Asia (Singapore) Private Limited is wholly owned by Baillie Gifford Overseas Limited and is regulated by the Monetary Authority of Singapore as a holder of a capital markets services licence to conduct fund management activities for institutional investors and accredited investors in Singapore. Baillie Gifford Overseas Limited, as a foreign related corporation of Baillie Gifford Asia (Singapore) Private Limited, has entered into a cross-border business arrangement with Baillie Gifford Asia (Singapore) Private Limited, and shall be relying upon the exemption under regulation 4 of the Securities and Futures (Exemption for Cross-Border Arrangements) (Foreign Related Corporations) Regulations 2021 which enables both Baillie Gifford Overseas Limited and Baillie Gifford Asia (Singapore) Private Limited to market the full range of segregated mandate services to institutional investors and accredited investors in Singapore.
173101 10057849